Headlines
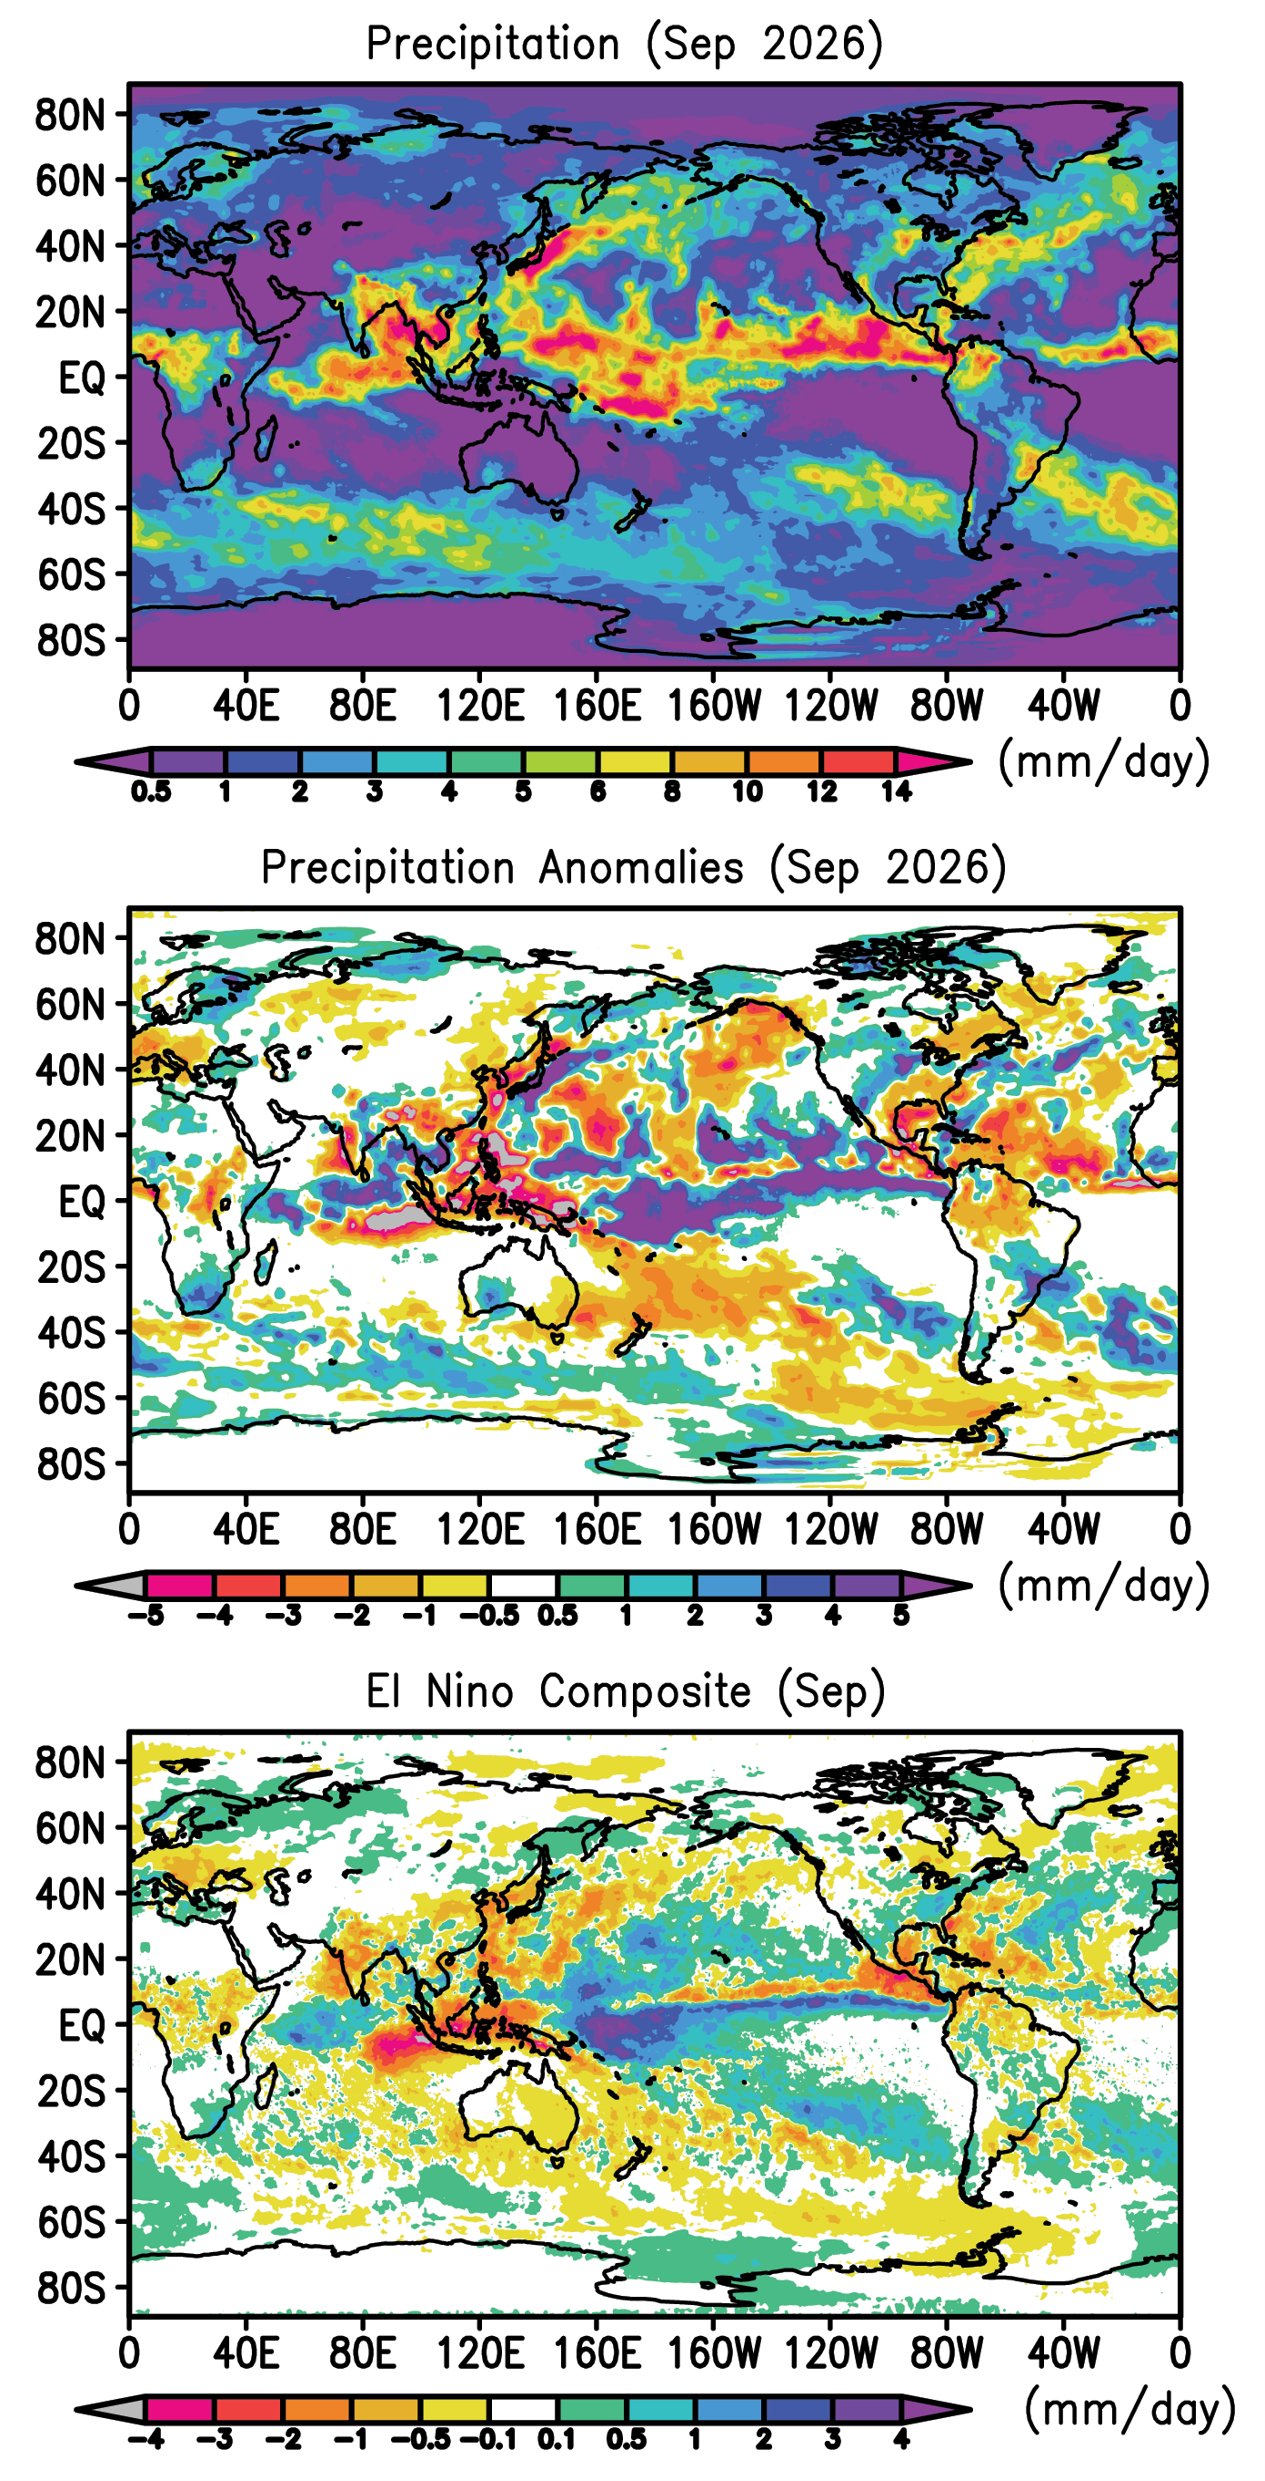
- The El Nino rainfall anomaly pattern remains dominant in the tropics but with nearly constant spatial correlation with the El Nino composite map for September.
- Pacific tropical cyclone activity remains very active with remnants providing moisture to the southwest U.S. with some flooding.
- The Atlantic ITCZ remains weak and still no Atlantic hurricanes through September.
- Serious flooding in Thailand and Myanmar.
The global precipitation pattern for September is dominated by the effects of the still intensifying El Nino. The SSTs in the tropical central Pacific are still increasing, hitting a +2.2C value for the RNino3.4 index at the end of September. This warm anomaly, and a cool anomaly in the western Pacific, change the distribution of ocean evaporation, convection and vertical motion, and rainfall. The impact on east-west distribution of rainfall anomalies across the tropics becomes obvious with such forcing from below. The forecast is for the El Nino to hit its peak in the SST index in December or so.
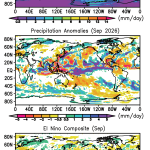
The global precipitation map (Fig. 1, top panel) shows the Pacific Ocean ITCZ very active and a little north of its usual position. The Asian monsoon is also very intense over the Indian sub-continent and over Indochina. The Atlantic ITCZ is still very weak. The anomaly map for this September (Fig. 1, middle panel) has classic El Nino signature features across the tropics, including the positive anomaly in the central/east Pacific, the intense dry zone across the Maritime Continent westward into the Indian Ocean just south of the Equator. In addition, to the east the dry region in northeast South America fits the scenario of this mode. Even the positive anomalies over the western Indian Ocean into the Horn of Africa and over southern Africa match the El Nino composite (from previous El Ninos) in Fig. 1, bottom panel. At the end of September serious floods occurred in Thailand, Myanmar and Nepal, somewhat matching the El Nino composite. A dry Gulf of Mexico and Central America does match the composite.
The eastern Pacific has been very active tropical cyclone-wise in September with a number of storms, including H. Polo, a Cat. 5 off of Mexico, and Hawaii affected by H. Nolo, the latest to affect the islands. Opposite to that, the Atlantic has not had a hurricane yet this season through September, an historic statistic. Moisture from remnants of some of those E. Pac. storms moved over the southwest U.S. and created a relatively wet region this month with some flash flooding in southern parts of Colorado and in New Mexico (see the middle panel). These storms and their effects may also have a tie to the El Nino. But overall the El Nino effect in North America was weak; that will probably have to wait until we get to the next few months, where an excess of precipitation is expected (but not guaranteed) across the southern tier of the U.S.
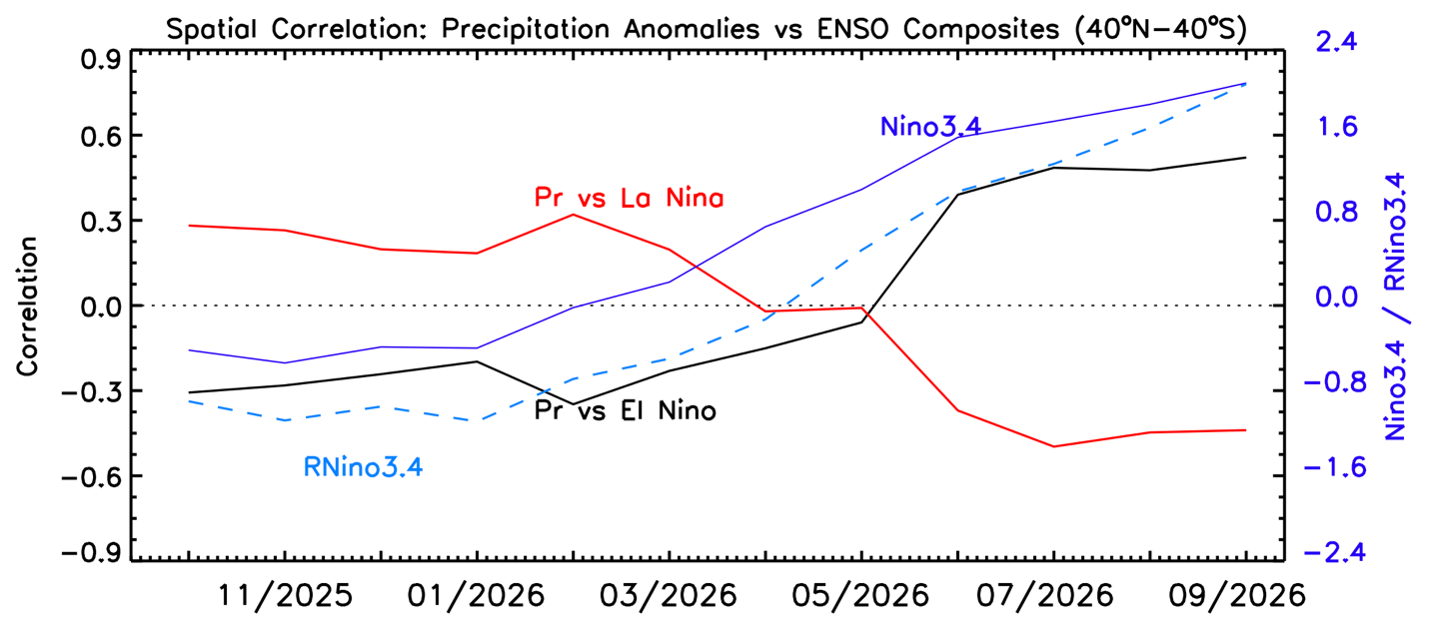
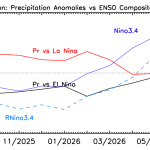
The pattern correlation between this month’s anomalies and the El Nino and La Nina composites (Fig. 2, black and red lines respectively) show a levelling off of the correlation despite the increasing Nino 3.4 index. We’ll keep an eye on whether that changes as we get into the next few months.
Table 1 Global precipitation and anomalies in September 2026.
| Mean Precipitation (September 1983-2025) | Precipitation (September 2026) | Precipitation anomaly (September 2026) |
Land+ocean | 2.83 | 2.91 | +0.08 |
Land | 2.27 | 2.18 | -0.09 |
Ocean | 3.06 | 3.22 | +0.16 |
The global anomalies for September continue to show the classic El Nino arrangement of positive over ocean and deficit over land, with the global total above the climatological mean (Table 1).
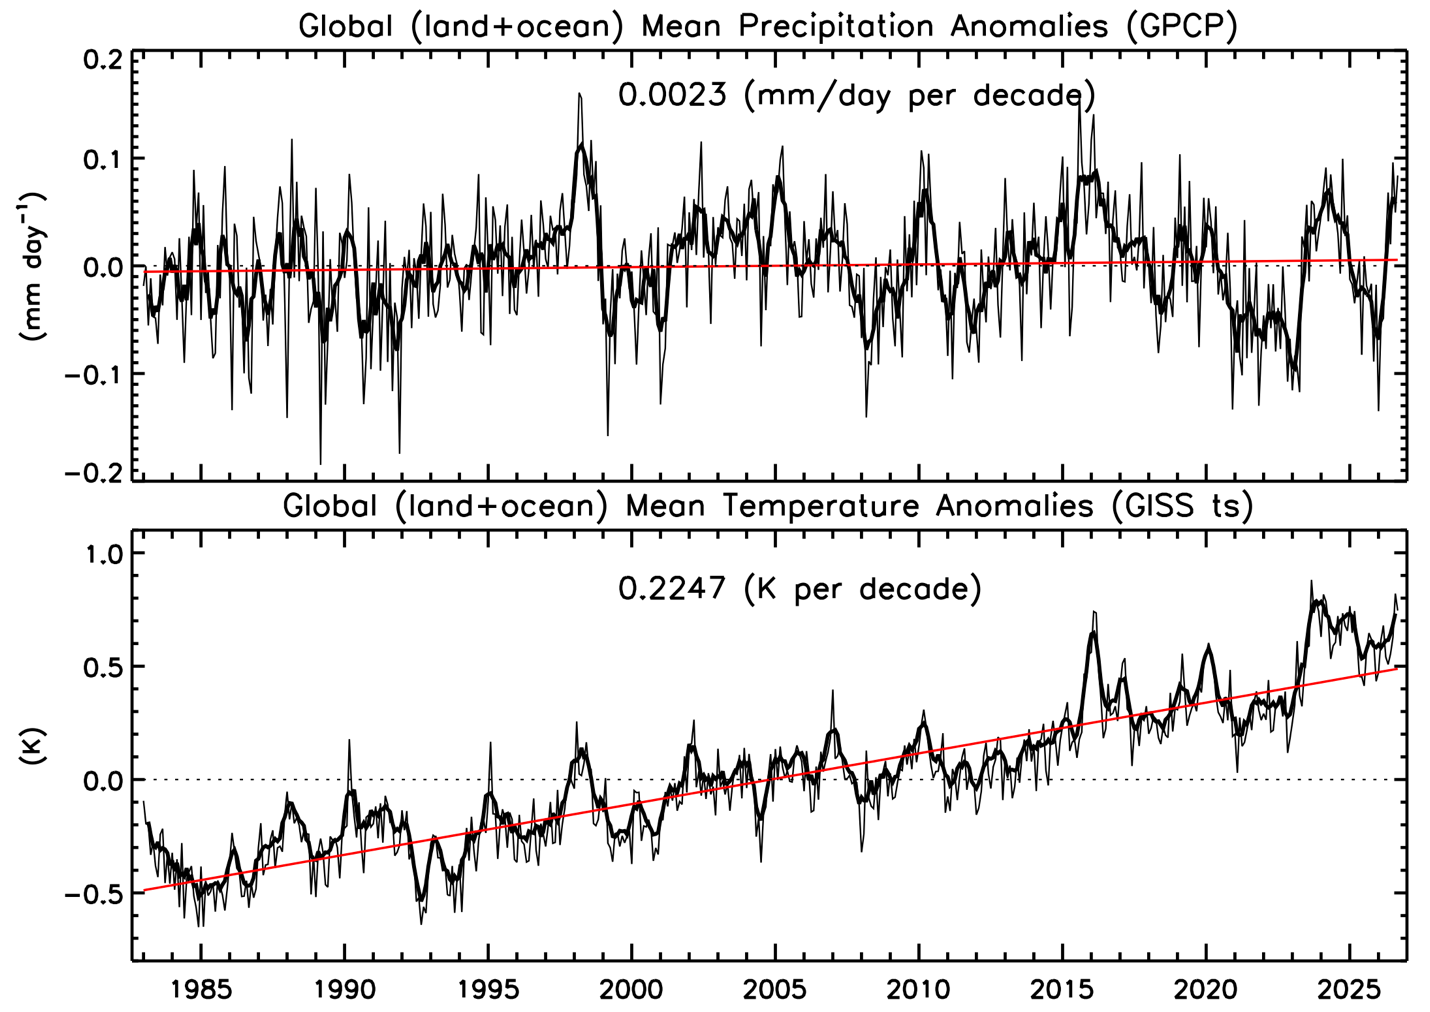
For completeness we show Fig. 3, the global total precipitation anomaly and surface temperature anomaly since 1983. Again this month the global surface temperature anomaly is above the trend line (as expected under El Nino conditions) and the global precipitation anomaly is above the long-term mean, again as expected under El Nino. If the current El Nino is followed by a La Nina it will be interesting to follow these two curves to see if they replicate the 2025 conditions of global precipitation below the mean, but global temperature staying above the trend line, which might indicate a steepening of the temperature increase.
BACKGROUND
The Global Precipitation Climatology Project (GPCP)
This global precipitation summary is based on V3.2 of the Monthly Global Precipitation Climatology Project (GPCP) product, an observation based analysis using satellite observations over oceans and satellite and rain gauge observations over land. The Monthly analysis extends from 1983 to the near present as a Climate Data Record (CDR) with an extension to the previous month (within ~ 12 days of the end of the month) as an Interim CDR, or ICDR.
The development of the GPCP CDR products (Monthly and finer time scales) is supported by NASA’s MEaSUREs program. The GPCP Monthly ICDR was developed and its routine calculation is supported by NOAA’s National Center for Environmental Information (NCEI). GPCP products are available at NASA’s Goddard Earth Sciences Data and Information Services Center (GES DISC) and from NOAA NCEI as well as ECMWF’s Climate Store.
The following references describe GPCP products in detail and provide additional research results using GPCP by the authors of this summary:
GPCP V3.2 paper:
Huffman, G. J. and R. Adler, A. Behrangi, D. Bolvin, E. Nelkin, G.Gu and M. Ehsani, 2023. The New Version 3.2 Global Precipitation Climatology Project (GPCP) Monthly and Daily Precipitation Products. J. Climate, 36, 7635- 7655. DOI: 10.1175/JCLI-D-23-0123.1.
GPCP V2.3 paper:
Adler, R., M. Sapiano, G. Huffman, J. Wang, G. Gu, D. Bolvin, L. Chiu, U. Schneider, A. Becker, E. Nelkin, P. Xie, R. Ferraro, D. Shin, 2018. The Global Precipitation Climatology Project (GPCP) Monthly Analysis (New Version 2.3) and a Review of 2017 Global Precipitation. Atmosphere. 9(4), 138; doi:10.3390/atmos9040138
Other references:Adler, R., G. Gu, M. Sapiano, J. Wang, G. Huffman 2017. Global Precipitation: Means, Variations and Trends During the Satellite Era (1979-2014). Surveys in Geophysics 38: 679-699, doi:10.1007/s10712-017-9416-4 Adler, R. F., G. Gu, G. J. Huffman, R. P. Sapiano and J. Wang, 2020: GPCP and the Global Characteristics of Precipitation. In Satellite Precipitation Measurement, Vol. 2, Chapter 35, 677-697. Advances in Global Change Research, 69, Springer Nature, doi:10.1007/978-3-030-35798-6_11.
Gu, G., and R. Adler, 2023. Observed Variability and Trends in Global Precipitation During 1979-2020. Climate Dynamics, 61, 131-150.
Adler, R. and G. Gu, 2024. Global Precipitation for the Year 2023 and How It Relates to Longer Term Variations and Trends. Atmosphere, 15(5). 10.3390/atmos15050535.
Gu, G. and R. Adler, 2024. Variability and Trends in Tropical Precipitation Intensity in Observations and Climate Models. Climate Dynamics, https://doi.org/10.1007/s00382-024-07287-y.
The GPCP analyses are also used as part of the annual State of the Climate report published in the Bulletin of the AMS, in the Precipitation section ( Ziese, M., R. S. Vose, R. Adler, G. Gu and X. Yin, 2026. Precipitation. [in “State of the Climate in 2025”]. Bull. Amer. Meteor. Soc., 107 (8), S59–S60, https://doi.org/10.1175/BAMS-D-26-0141.1)