The following review is not meant to be an all-encompassing account of National Weather Service (NWS) products and services for this event, it is a short review, mainly from a satellite perspective. Additional information is being compiled and will be available in the near future with a complete look at NWS products and services.
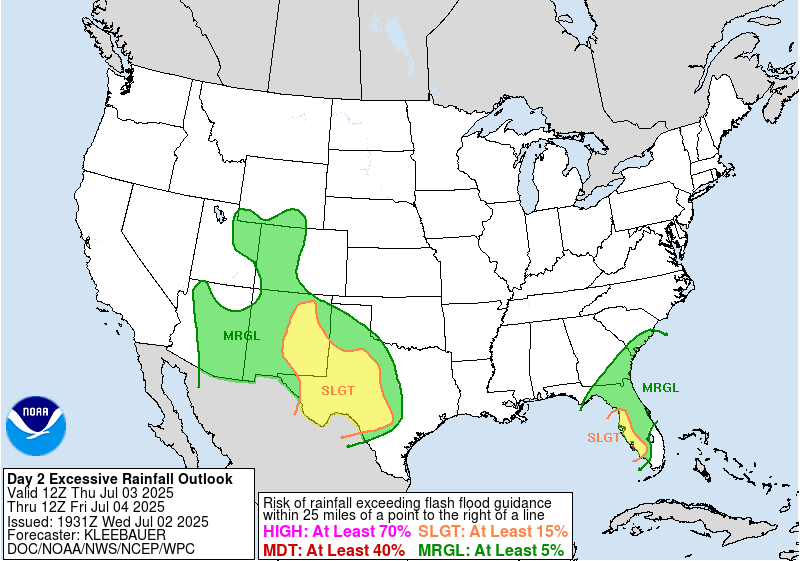
Catastrophic and deadly flash flooding struck South-Central TX over the July 4 holiday weekend, fueled by an extremely moist air mass in place. The NWS Weather Prediction Center (WPC) issued a Day 2 Slight Risk for Excessive Rainfall, or at least a 15 percent chance for flash flooding within 25 miles of a point, for the 24-hour period ending at 1200 UTC 04 July 2025. This Slight Risk was an upgrade from the Marginal Risk that was in place from the morning ERO issuance at 0809 UTC 02 July 2024, signifying an increase in the probability of flash flooding. Flood Watches were also issued by offices such as NWS Austin/San Antonio TX on 03 July.
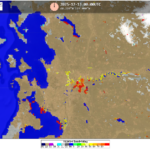
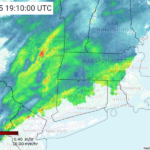
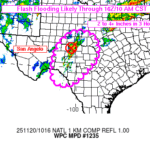
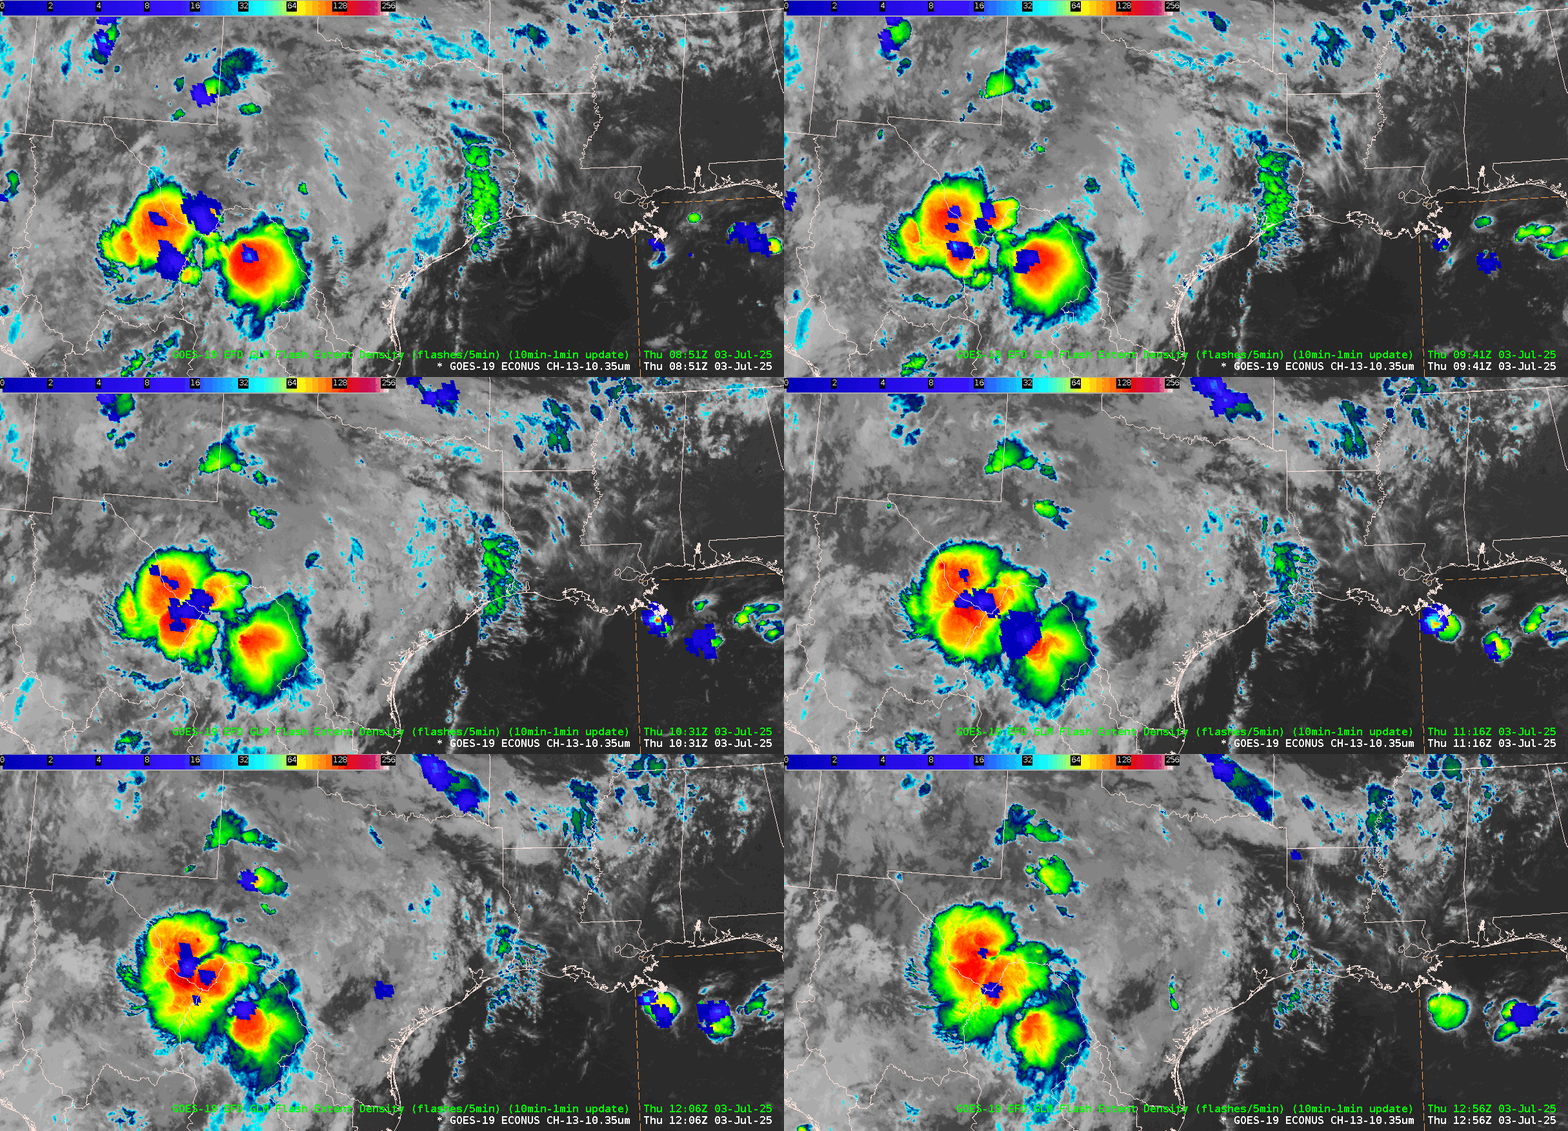
The flash flooding threat started first across Southwest TX early in the day on 03 July 2025. WPC forecasters utilized the GOES Radar Estimation via Machine-Learning to Inform NWP (GREMLIN) product, recently made available in operational workstations, to track a Mesoscale Convective System (MCS) as it pushed towards TX from a radar sparse region in Mexico. The WPC Met Watch team issued a Mesoscale Precipitation Discussion (MPD) at 1138 UTC 03 July to highlight the flash flood risk over the following 6 hours, noting “GOES-E IR imagery this morning shows an expanding area of cooling cloud tops…GOES-E GREMLIN radar emulation appears to match the IR imagery quite nicely showing higher reflectivity lifting towards the international border”. You’ll notice in the animation below, GREMLIN reflectivities are higher in areas where the GLM Flash Extent Density (FED) is detecting lightning. GLM was one of the training inputs for the product’s machine learning technique.


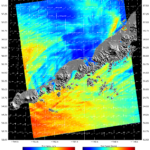
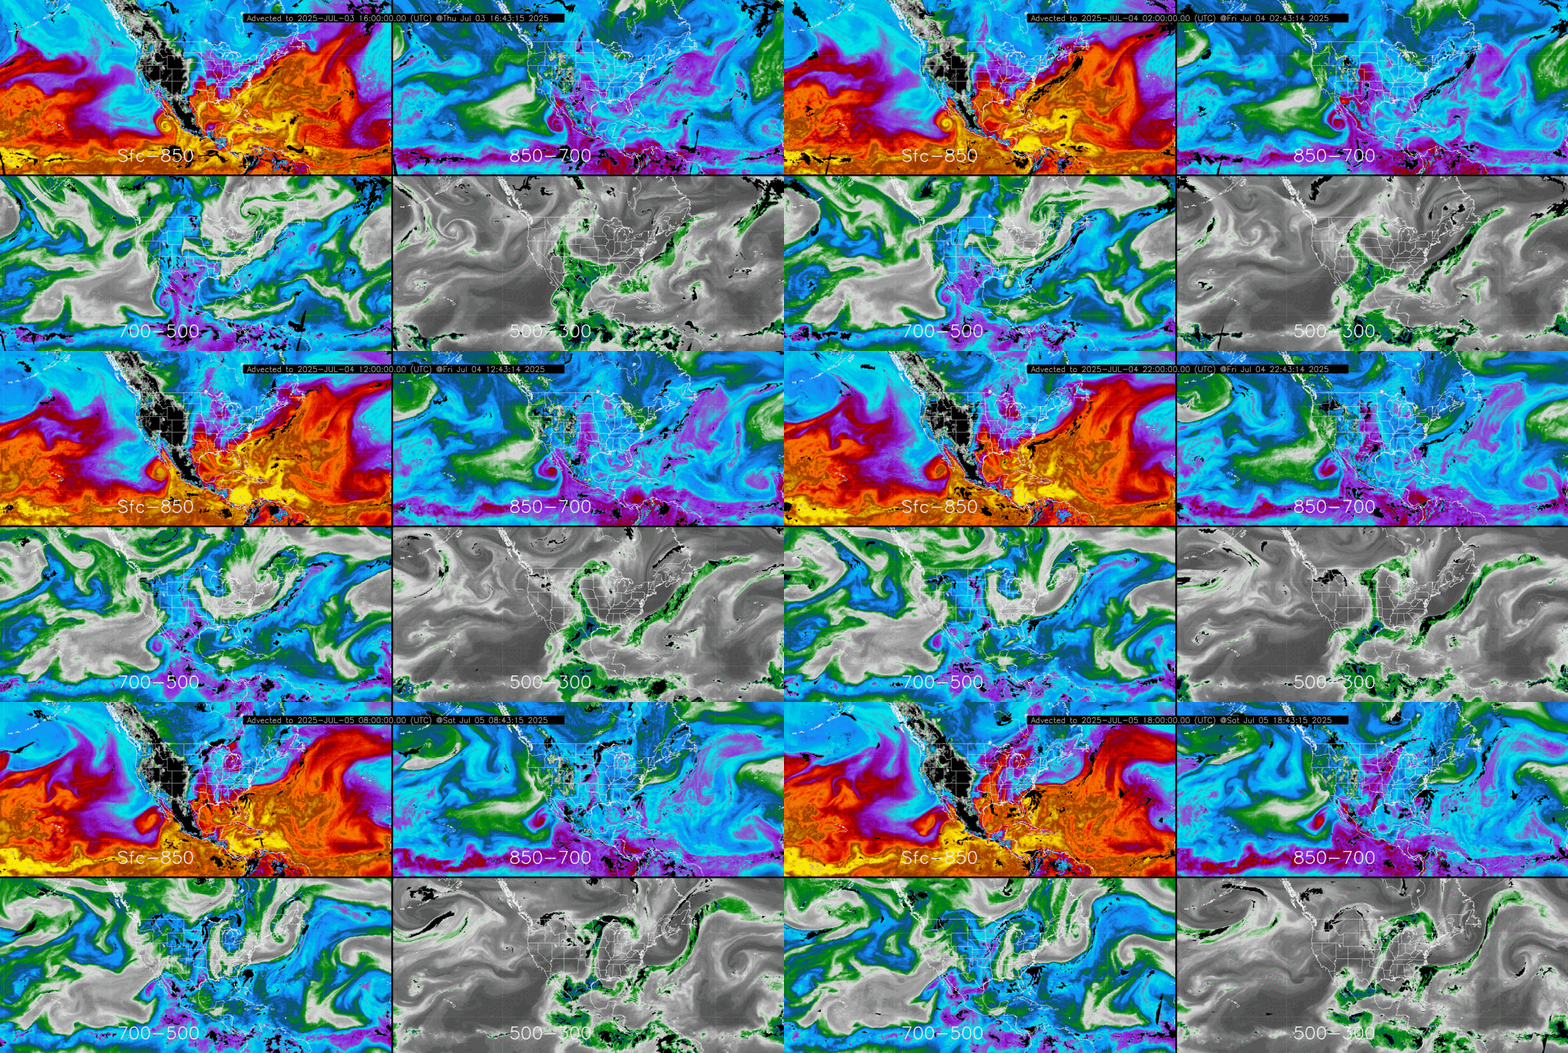
The Advected Layered Precipitable Water Product, recently made operational by NESDIS/Office of Satellite and Product Operations (OSPO) after being developed at the Cooperative Institute for Research in the Atmosphere (CIRA), provided a look at the evolution of the moisture heading towards TX from ~1600 UTC 03 July to ~1800 UTC 05 July 2025. In the lower levels (Surface – 850 hPa, 850 – 700 hPa), moisture is streaming north, while a connection can be seen at the upper-levels (700 – 500 hPa, 500 – 300 hPa) to the then dissipating Tropical Storm Flossie in the East Pacific.
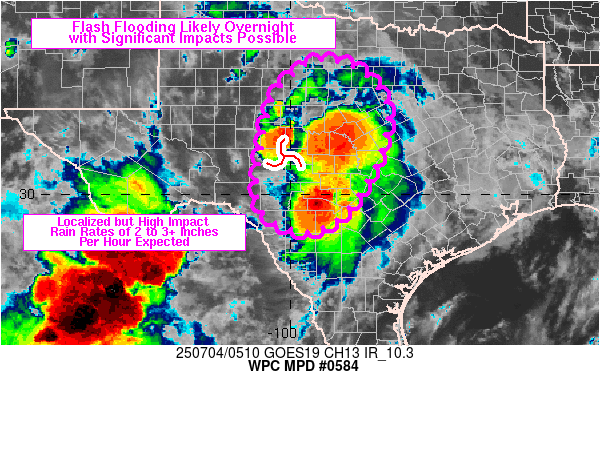
Heading into the late evening on 03 July 2025, the NWS Weather Forecast Office (WFO) in San Angelo issued a Flash Flood Warning at 0406 UTC 04 July for parts of McCulloch and San Saba counties, followed by WFO Austin/San Antonio issuing a Flash Flood Warning at 0441 UTC for Central Bandera County. WPC issued an MPD for South-Central TX at 0526 UTC 04 July 2025, stating ‘Some flash flood impacts could be significant, especially considering sensitive terrain over portions of the region.’… as ‘The region was located within an extremely moist environment containing 2.0 to 2.5 inches of PW with contributions from the Gulf of America and tropical east Pacific clearly evident on layered PW imagery.’
GOES-East Mid-Level Water Vapor (WV) Band 9 from ~1000 UTC 03 July to ~1800 UTC 04 July 2025 with the 500-hPa RAP mesoanalysis field showed a mid-level disturbance tracking from northern Mexico and Southwest TX to South-Central TX by the early morning of 04 July. The NWS San Angelo Area Forecast Discussion (AFD) issued at 0716 UTC 04 July 2025 stated ‘WV imagery early this morning is showing a slow moving/weak disturbance across our area. Also, PW values are around record values (2.2 to 2.4 inches) and deep moisture flux convergence over the Heartland”.
Figure 7: GOES-East Full-Disk Mid-Level WV imagery from ~1000 UTC 03 July to ~1800 UTC 04 July 2025. This video was created from AWIPS, and display files can be shared upon request. Courtesy of Bill Line (NESDIS/STAR)
GOES-East GLM FED from ~0300 to ~1200 UTC 04 July 2025 detected abundant lightning, and several lightning ‘jumps’, or large increases in FED during a short period of time, as the storms sat nearly stationary across South-Central TX. Additionally, a 375-m NOAA-20/VIIRS “I5” Band (11.45 micron) pass at 0751 UTC 04 July 2025 offered more spatial resolution than the 2-km Band 13 imagery from GOES/ABI, and depicted cloud top temperatures as cold as -88 degrees Celsius.
Figure 8: GOES-East CONUS GLM FED overlaid on Geocolor imagery from ~0300 to ~1200 UTC 04 July 2025. From NESDIS/STAR, courtesy of Bill Line

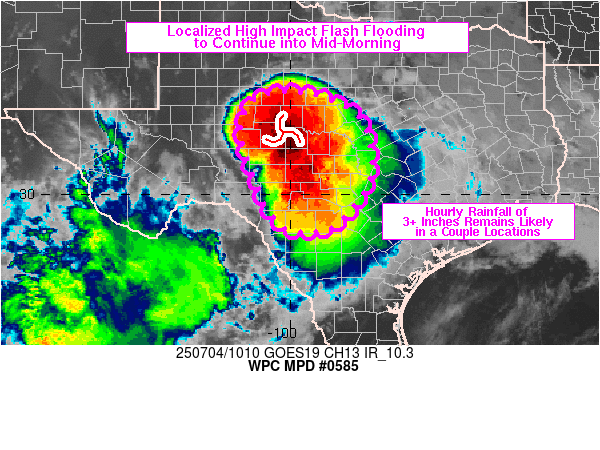
GOES-East Band 13 IR imagery overlaid with Flash Flood Warnings issued by WFOs highlighted the rapid expansion of warnings after ~0600 UTC 04 July 2025. Flash Flood Emergencies are indicated by the thicker blue-green polygons, beginning around ~0900 UTC (4 a.m. CDT). A second MPD was issued at 1027 UTC 04 July 2025, as ‘Considerable to catastrophic flash flood impacts can continue to be expected.’
Figure 10: GOES-East Band 13 IR imagery overlaid with Flash Flood Warnings and Flash Flood Emergencies from ~0320 to ~1000 UTC 04 July 2025. This video was created from AWIPS, and display files can be shared upon request. Courtesy of Bill Line (NESDIS/STAR)
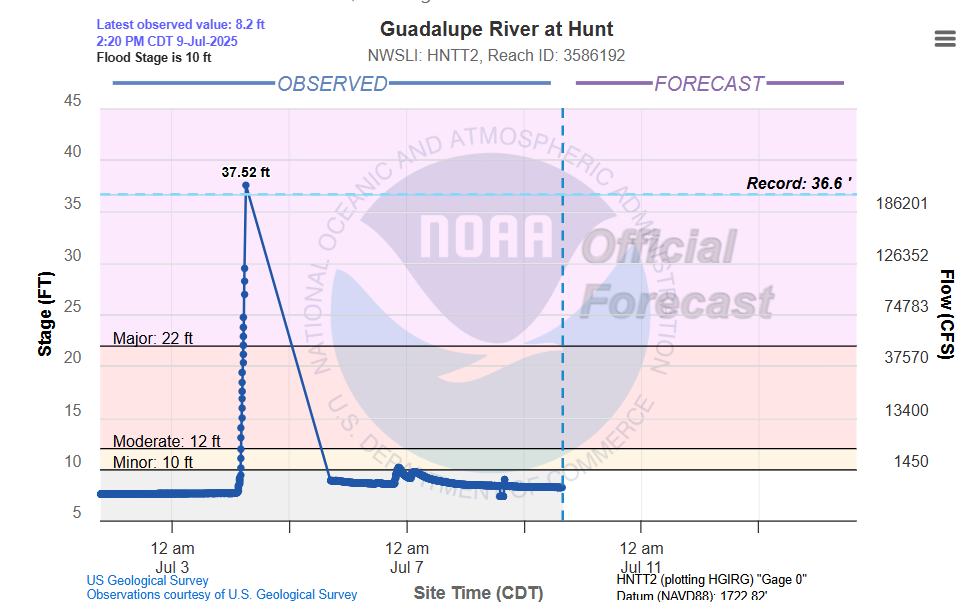
Preliminarily, the gauge at Guadalupe River at Hunt, TX, indicated more than a 20-foot rise in the water level in less than 90 minutes during the early morning of 04 July, with a record-breaking crest of 37.52 feet. Unfortunately, this extreme flash flooding resulted in catastrophic impacts and a loss of lives along the Guadalupe River.
The repeating rounds of storms from 03 July to 07 July 2025 resulted in over 20″ of rain in parts of TX.
This entry is co-authored by Bill Line, NESDIS/STAR


