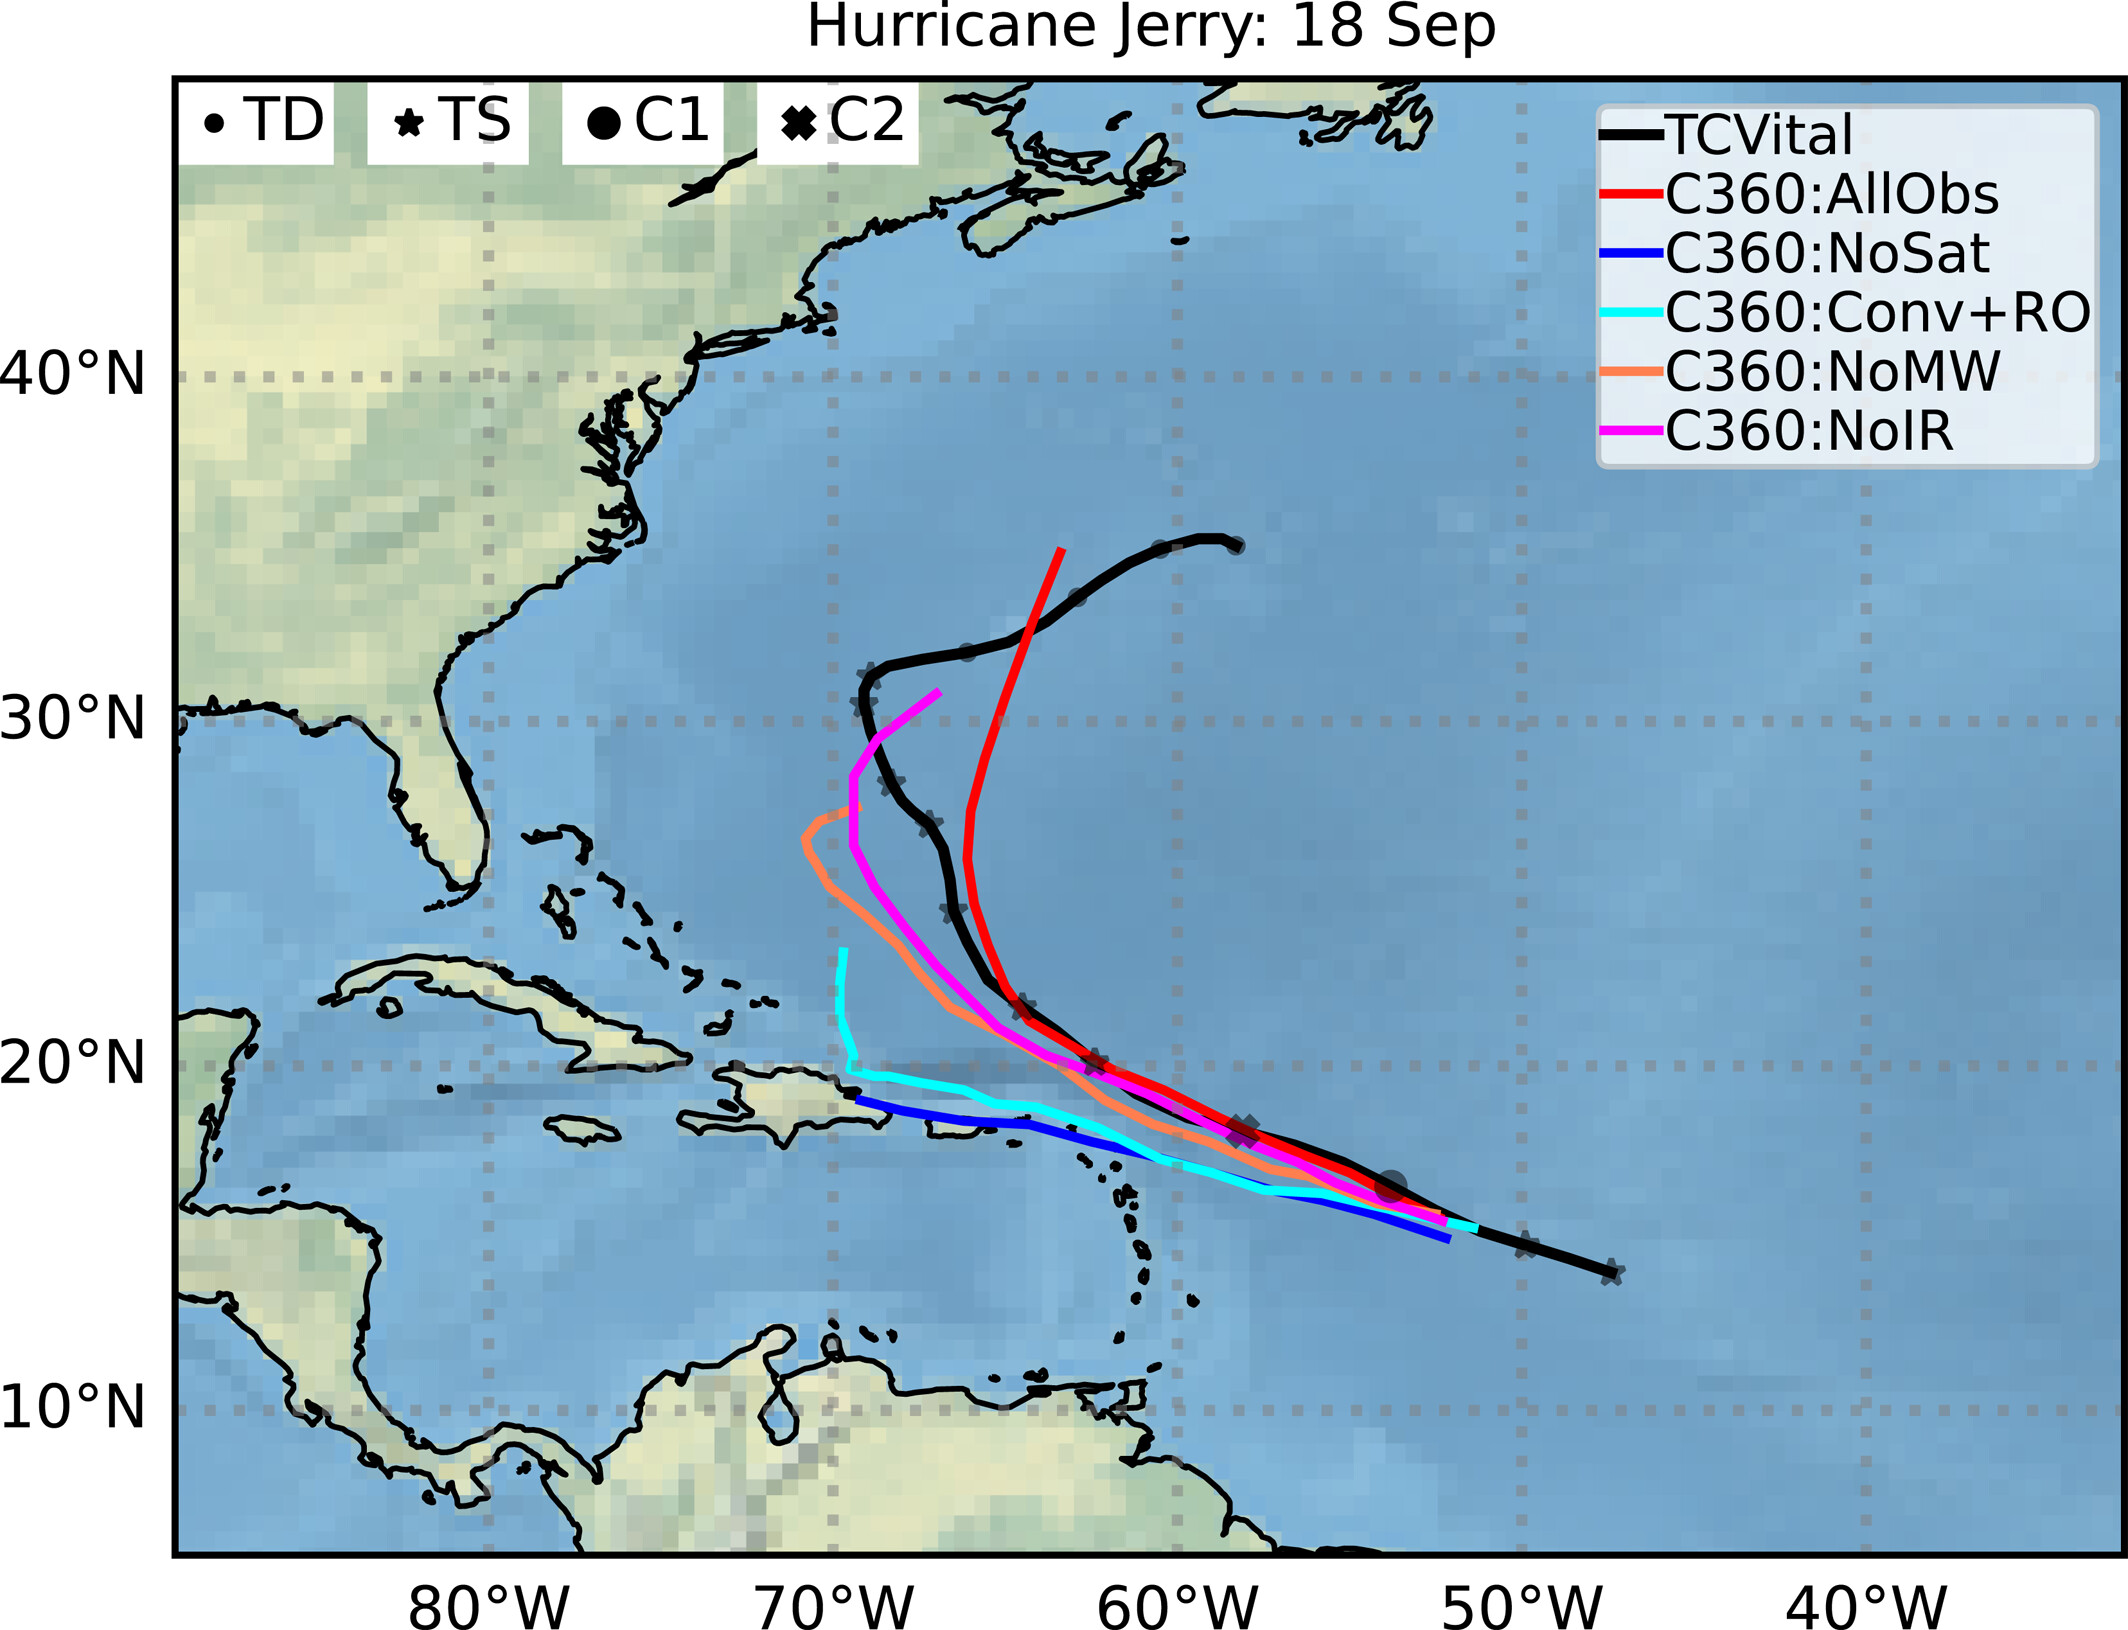
![](https://essic.umd.edu/wp-content/uploads/2024/10/IMG_3331-1-150x150.jpg)
Early Career Scientist Spotlight: Dr. Allison Chartrand
- Cazzy Medley
- Highlights
Latest News
![](https://essic.umd.edu/wp-content/uploads/2024/10/IMG_3331-1-150x150.jpg)
![TROPICS TMS observations of Hurricane Ida on 28 August 2021 at 20:07 UTC. TMS F-band and 205 GHz observations resolve finer hurricane structure in terms of eye, eyewall, and rainbands.](https://essic.umd.edu/wp-content/uploads/2024/12/yang-fig1-150x150.png)
![](https://essic.umd.edu/wp-content/uploads/2024/12/Copy-of-Holiday-Party-202223-150x150.png)
ESSIC Celebrates 2024 Peer Awards
December 18, 2024
![Earth’s rainy days are changing and plant life is responding. This visualization shows average precipitation for the entire globe based on more than 20 years of data from 2000 to 2023. Cooler colors indicate areas that receive less rain. Warm colors receive more rain. NASA’s Scientific Visualization Studio](https://essic.umd.edu/wp-content/uploads/2024/12/1-precip-map-150x150.jpg)
Crops, Forests Responding to Changing Rainfall Patterns
December 12, 2024
![Figure 1. Time series of global monthly anomalies of 2-meter air temperature (top) and TPW (bottom) derived from ERA5 analyses. The straight lines are the linear trends derived from the monthly anomalies. Anomalies and trends are shown for global means based on 1:30 am/1:30 pm local time data only (red) and all hourly data (black). The anomalies and trends for both data sets are so similar that the black curves are almost obscured by the red curves. Computed annual trend values for both 24-hour and 1:30 am/pm data are shown in blue and red, respectively.](https://essic.umd.edu/wp-content/uploads/2024/12/figure1-yzhou-150x150.png)