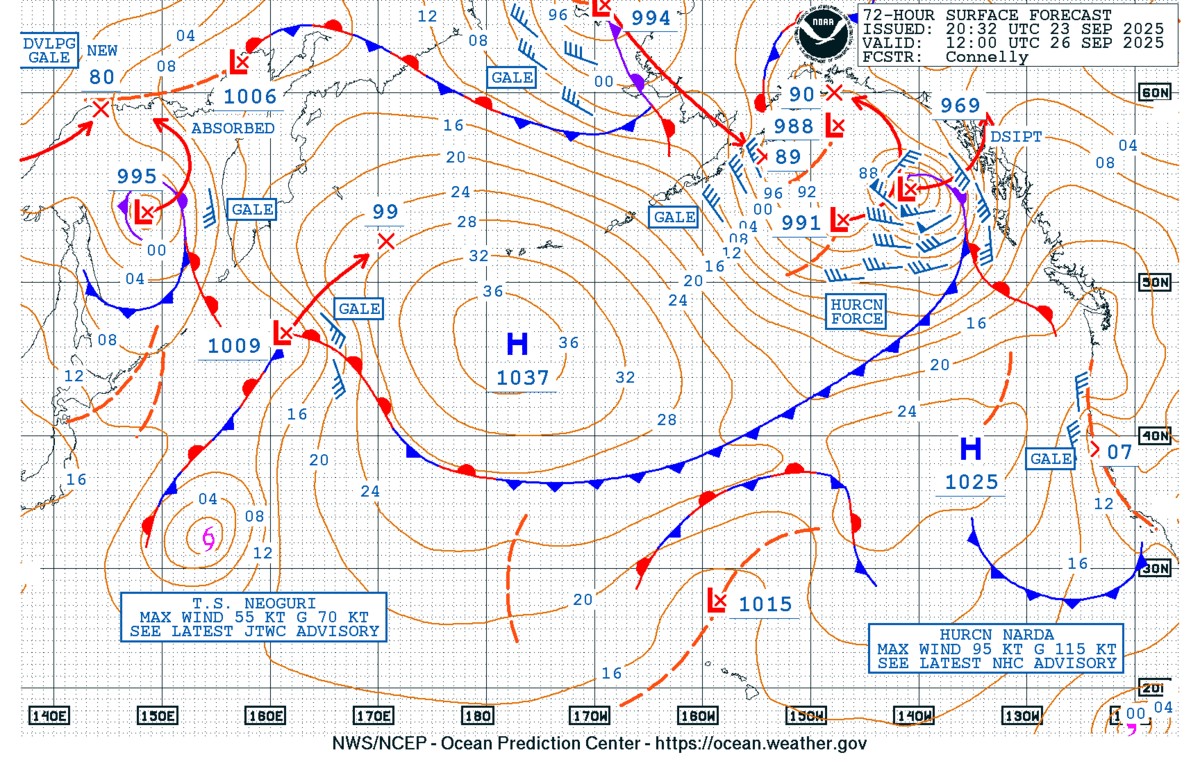
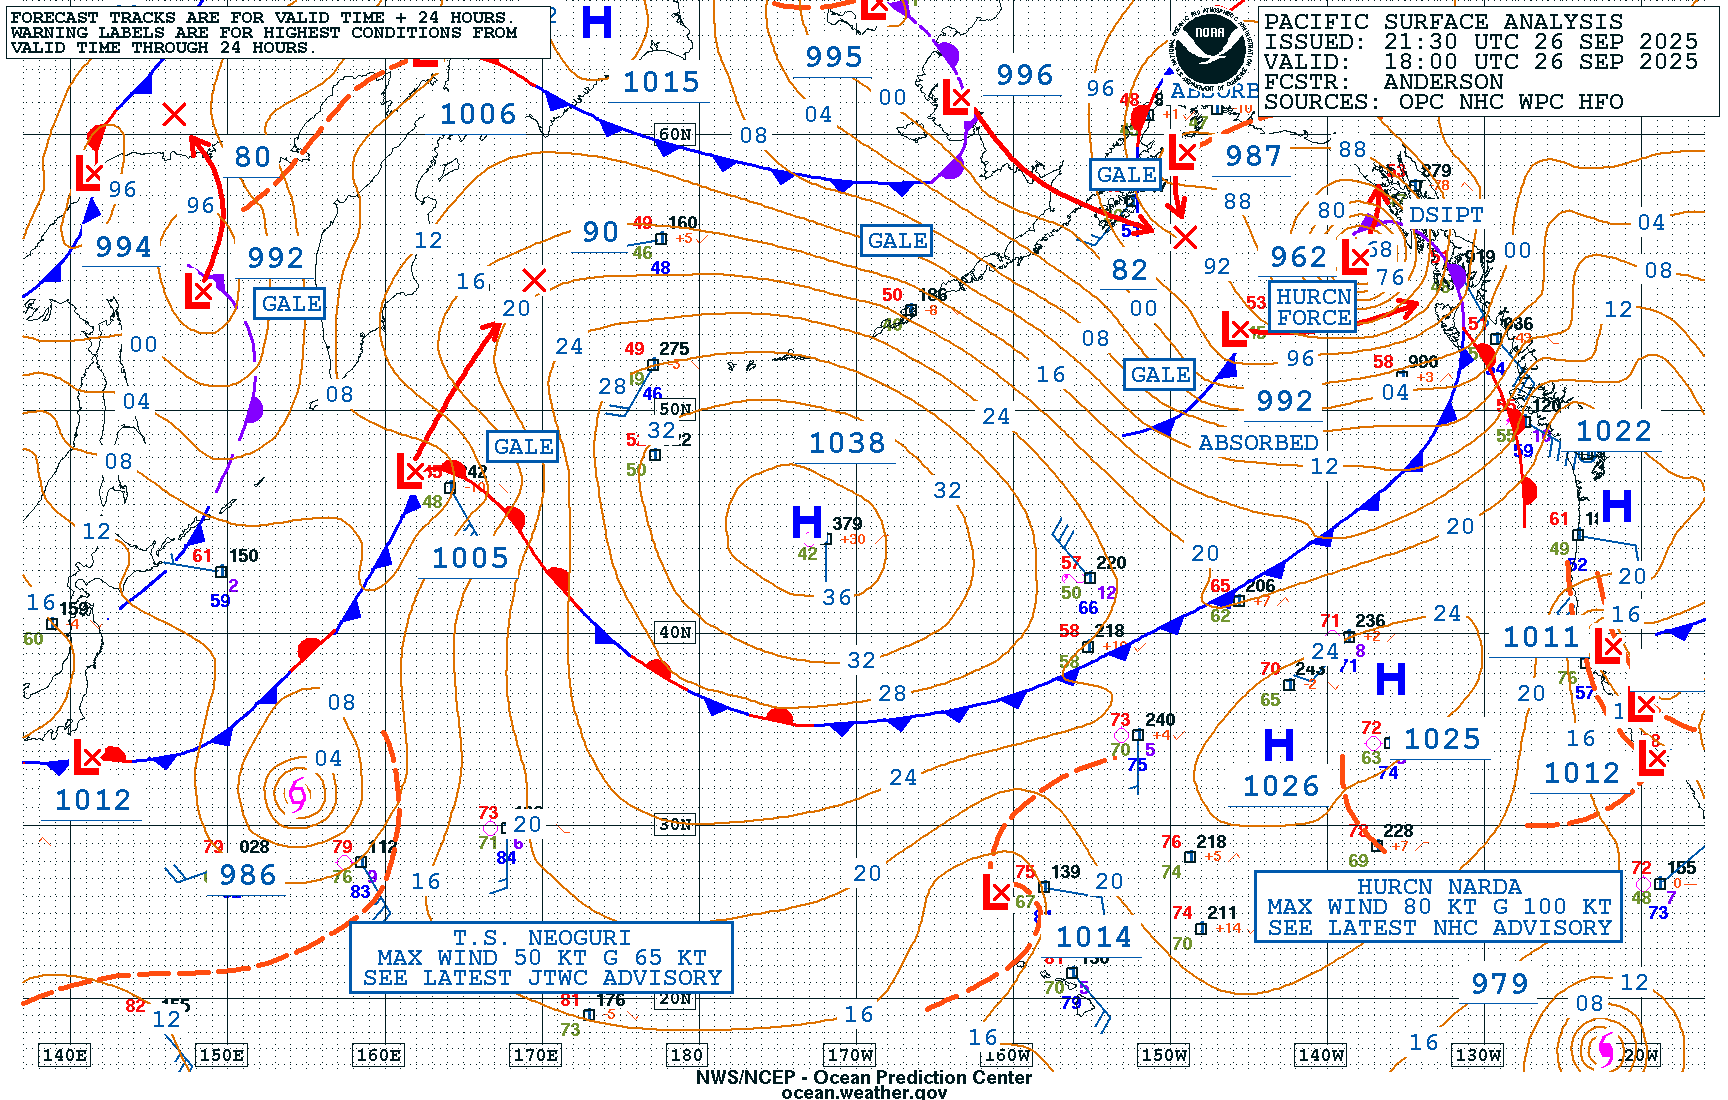
Right on cue with the arrival of early autumn, a powerful hurricane-force low developed in the Gulf of Alaska and impacted southeastern Alaska last week. The NWS Ocean Prediction Center (OPC) 72-Hour Surface forecast valid at 1200 UTC 26 September 2025 indicated a 969 hPa hurricane-force low just off the coast of Southeast Alaska, including Juneau. The forecast verified well, with the Pacific Surface Analysis at 1200 UTC 26 September showing a 972 hPa hurricane-force low nearly in the exact position as forecasted three days prior.

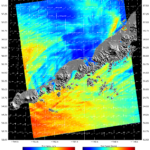
Just a few hours before the low pressure became hurricane-force, an OceanSat-3 (OSCAT-3) scatterometer passed captured the strongest winds developing in the system’s southern quadrants, with a region of storm-force winds up to ~55 knots.

GOES-West Full Disk Air Mass RGB imagery from ~0530 to ~1530 UTC 26 September 2025 showed the structural changes as the extratropical cyclone rapidly intensified. The dark red and orange colors quickly envelope the system’s circulation and a well-defined occlusion develops as the low pressure intensifies. In the 12 hours from 0600 UTC to 1800 UTC 26 September 2025, the minimum central pressure dropped from 987 hPa to 962 hPa, a drop of 25 hPa, or more than 2 hPa per hour!


Visible imagery from a GOES-West mesosector provided a look at the powerful hurricane-force low as the sun rose from ~1530 to ~1900 UTC 26 September 2025. The spin of the circulation is clearly depicted in the high-resolution, 500-meter resolution visible imagery as the system inched towards the Southeast Alaska Coast.
Figure 5: GOES-West Mesosector Visible Imagery from ~1530 to ~1900 UTC 26 September 2025. This video was created from AWIPS, and display files can be shared upon request.
The large and intense wind field yielded very large waves. An Altika altimeter pass at ~1530 UTC 26 September 2025 observed wave heights in excess of 17 feet, well to the west of the low pressure. NWS OPC Wind/Wave Analysis at 1800 UTC indicated Significant Wave Heights, or the average height of the highest 1/3 of the waves, in excess of 10 meters, or nearly 33 feet, closer to the center of circulation. Avoiding the dangerous weather, there were only a few ships located in the Gulf of Alaska at ~1530 UTC.


A Synthetic Aperture Radar (SAR) pass from the RADARSAT Constellation Mission-3 (RCM-3) satellite went directly overhead the storm system at ~1535 UTC 26 September 2025. The NOAA STAR Water Surface Conditions Science Team applied the Tropical Cyclone geophysical model function to convert the RCM normalized radar cross sections to wind speed. RCM-3 SAR wind observations were in excess of 85 kt in the southern quadrant, matching well with a Hurricane Force Wind Warning issued by NWS WFO Juneau for offshore waters in the Gulf of Alaska, with “SW wind gusts up to 90 kt”. Stellar coordination was noted throughout the event between NWS OPC and NWS WFO Juneau.


