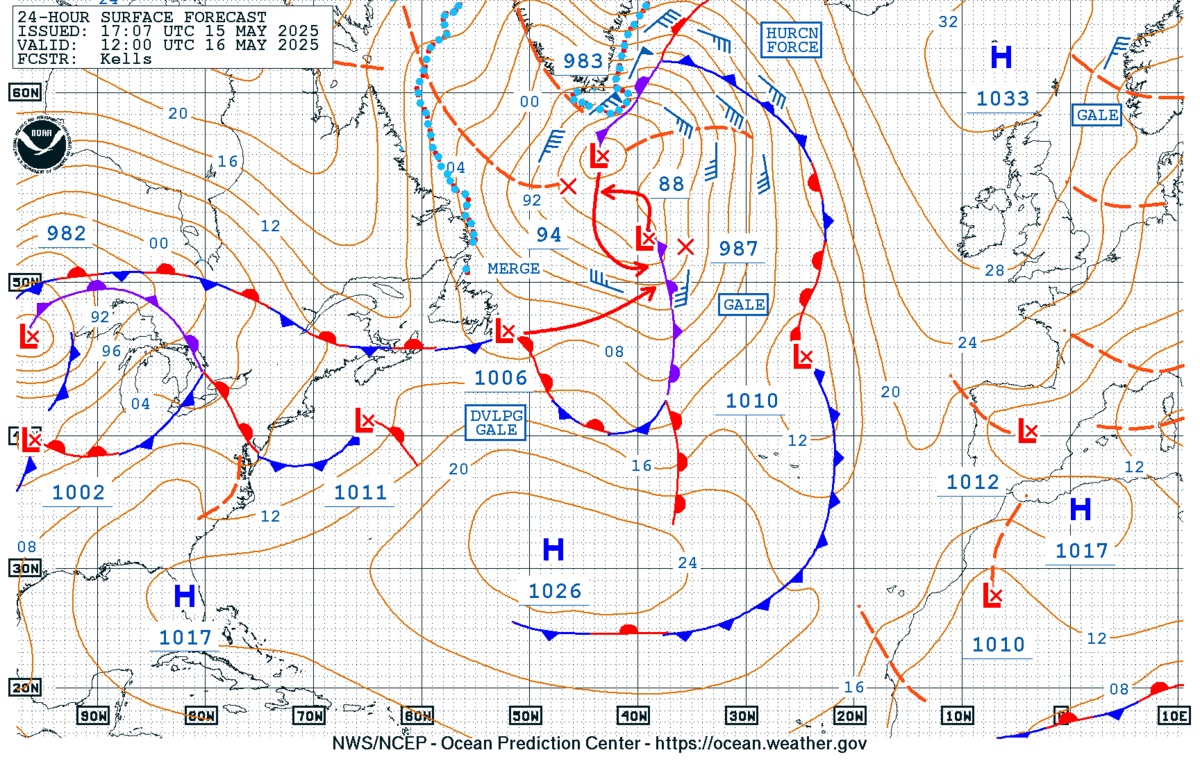
A hurricane-force low developed last week, with the system located in the favored North-Central Atlantic storm track for late-season intense extratropical cyclones. The National Weather Service (NWS) Ocean Prediction Center (OPC) North Atlantic 24 Hour Surface Forecast issued at 1707 UTC 15 May 2025 had a 983 mb hurricane-force low just south of the tip of Greenland at 1200 UTC 16 May 2025.
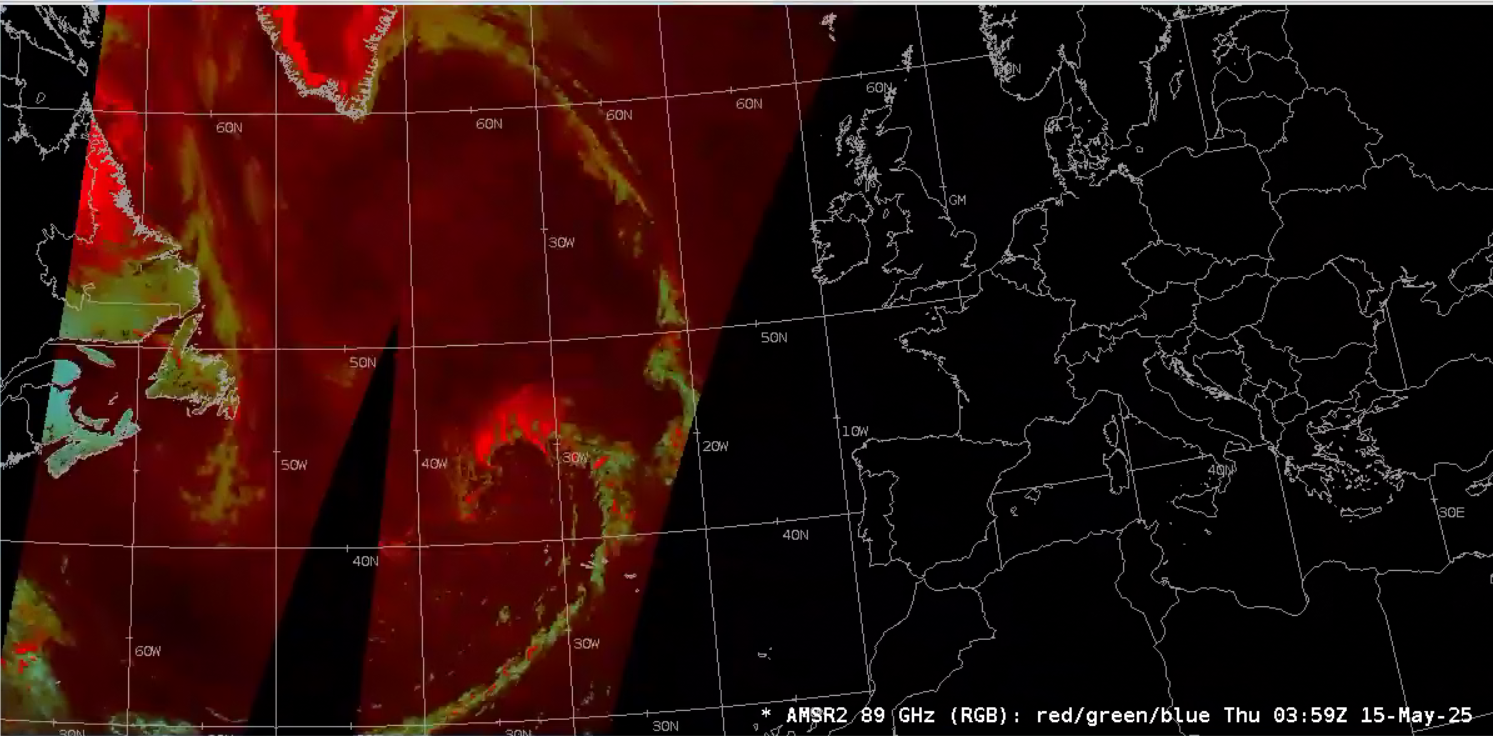
The Japanese GCOM-W/AMSR2 89 GHz Microwave RGB imagery tracked the structure of the then gale-force low across the Central Atlantic as the calendar flipped to 15 May 2025. Evident in the imagery is intense convection (bright red) along the occluded front and thick clouds with less intense convection (blues) along the cold front. You’ll notice farther to the north and east, additional thick cloud cover along an additional occluded front and more bright red colors in Greenland indicating ice.
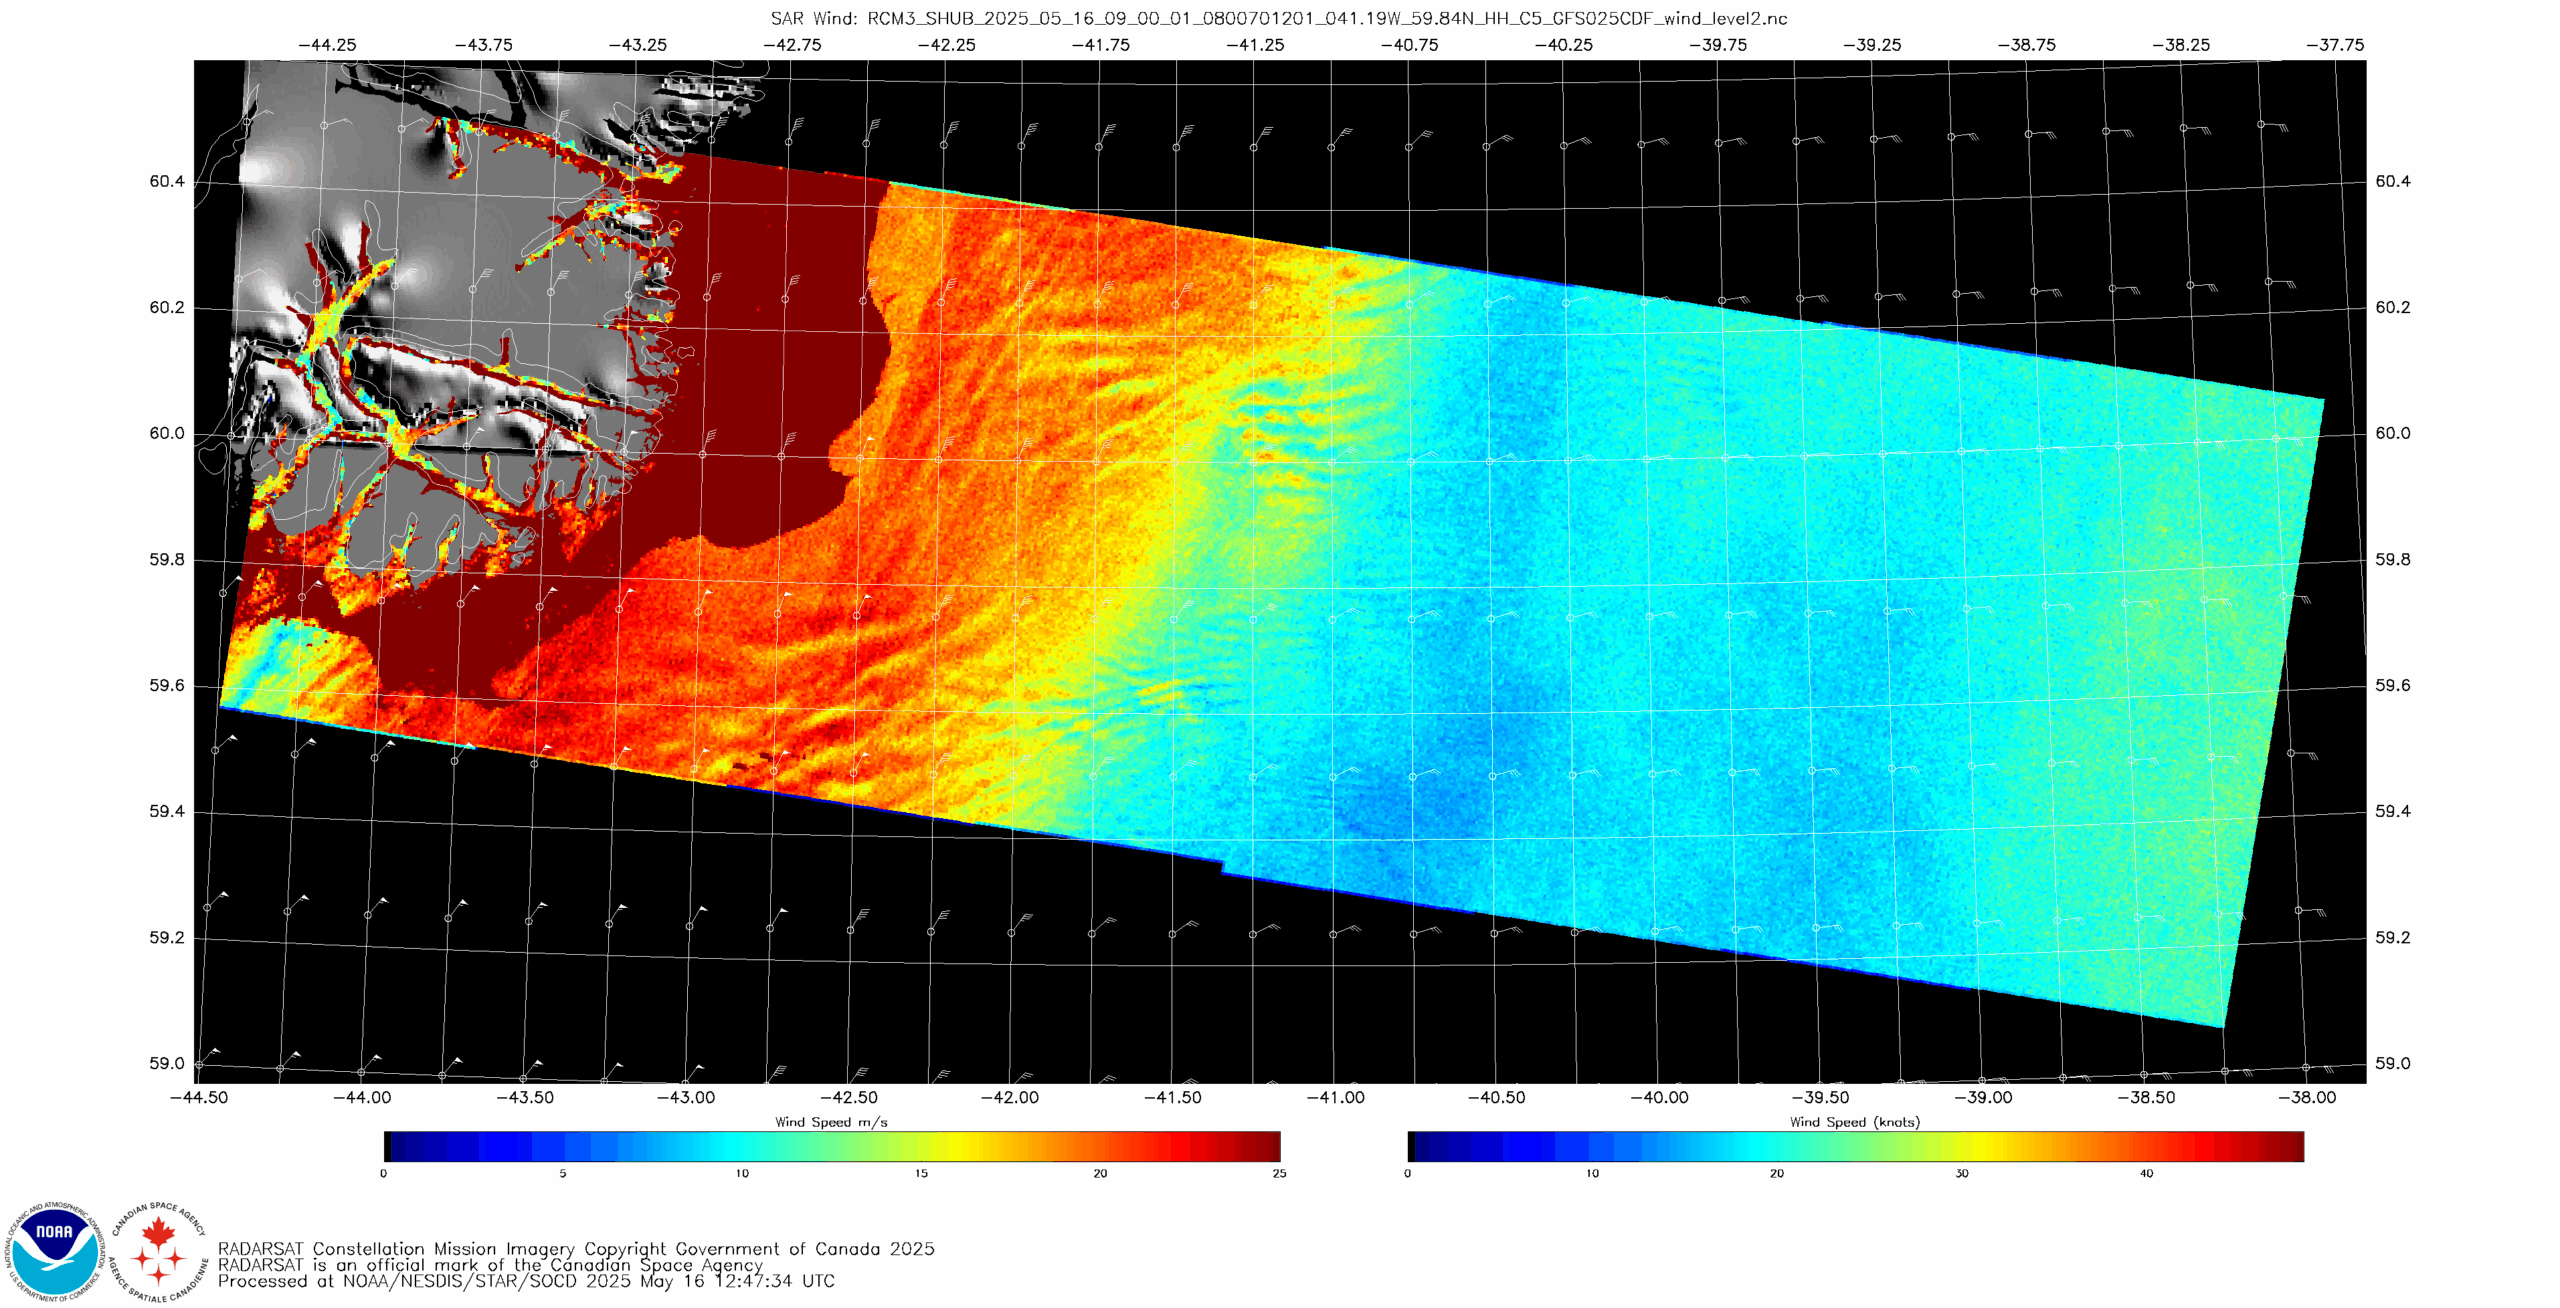
RadarSat Constellation Mission – 1, 3rd flight unit (RCM-3) Synthetic Aperture Radar (SAR) Winds were available just to the east of the southern tip of Greenland at ~0900 UTC 16 May 2025. The output showed storm-force winds in excess of 50 kt, and you’ll also notice ice cover where the solid, maroon color is located. The background wind barbs, where the wind imagery from SAR Normalized Radar Cross Section is not available, is derived from the GFS model output. SAR winds provide 500-m spatial resolution, compared to much coarser scatterometer output at 12.5 or 25 km.
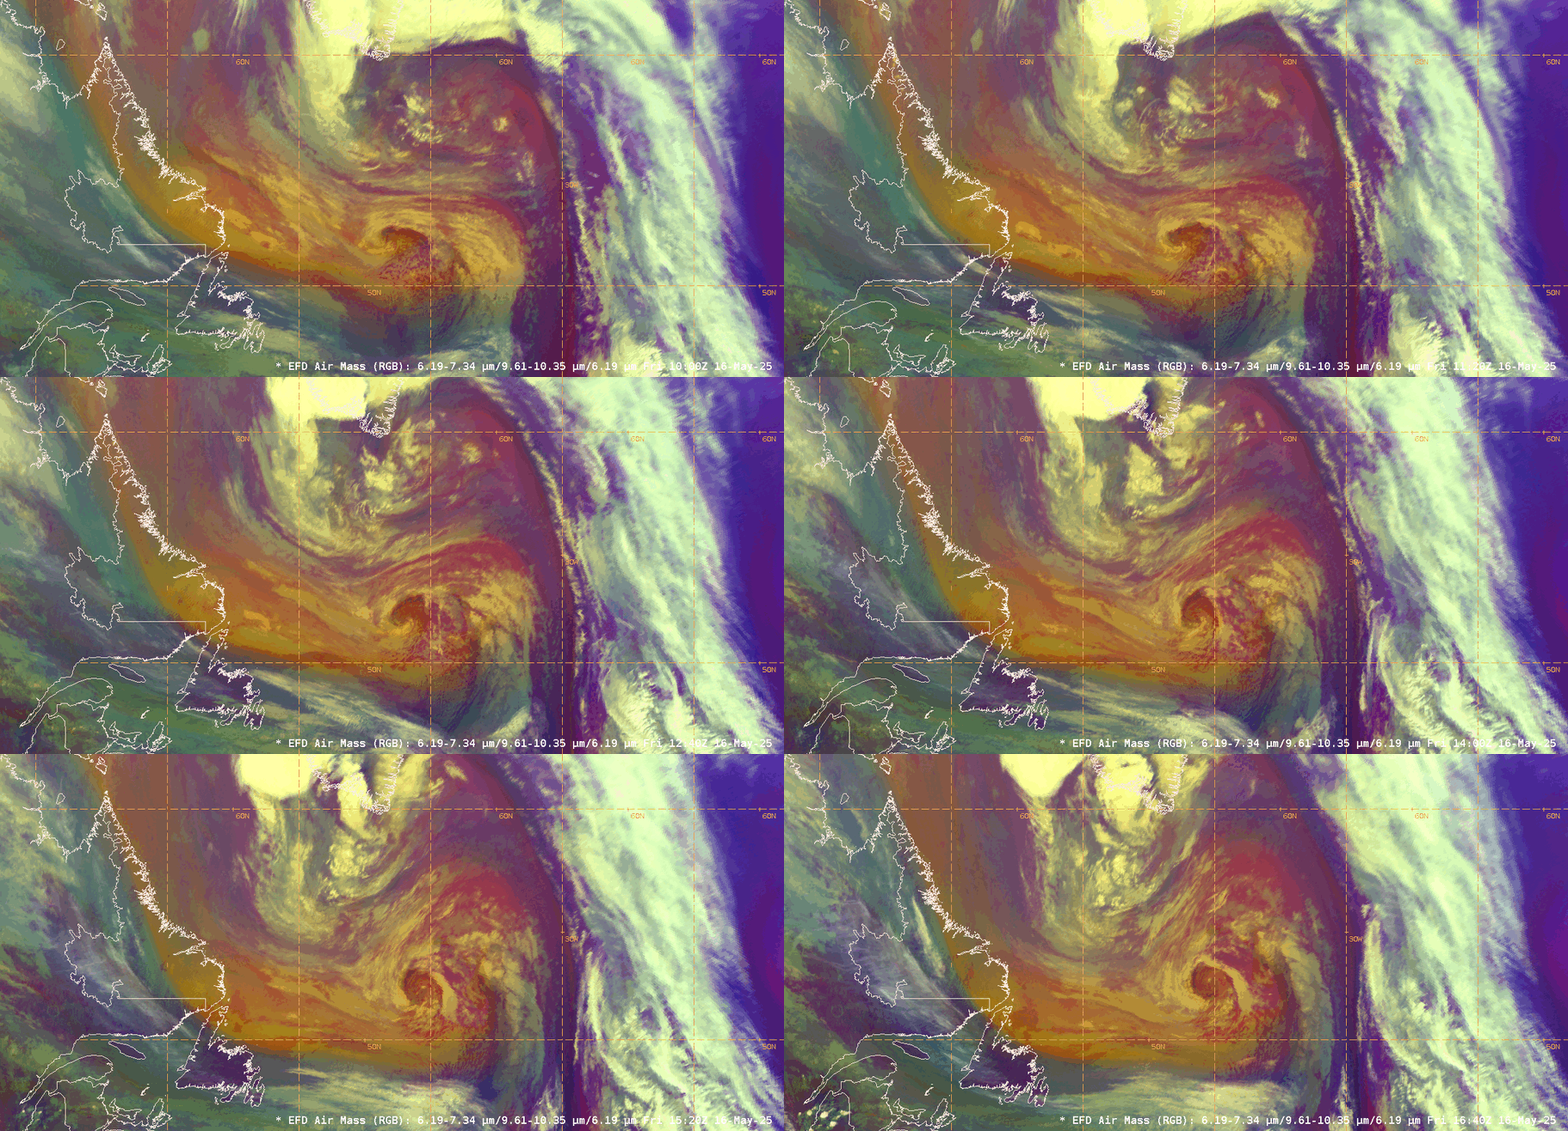
GOES-East 10-minute Full Disk Airmass RGB imagery from ~1000 to ~1700 UTC 16 May 2025 showed the the low pressure system slowly spinning northeastward, with the circulation collocated with an intrusion of stratospheric air (dark oranges, deep reds) with high levels of potential vorticity courtesy of an upstream tropospheric fold.
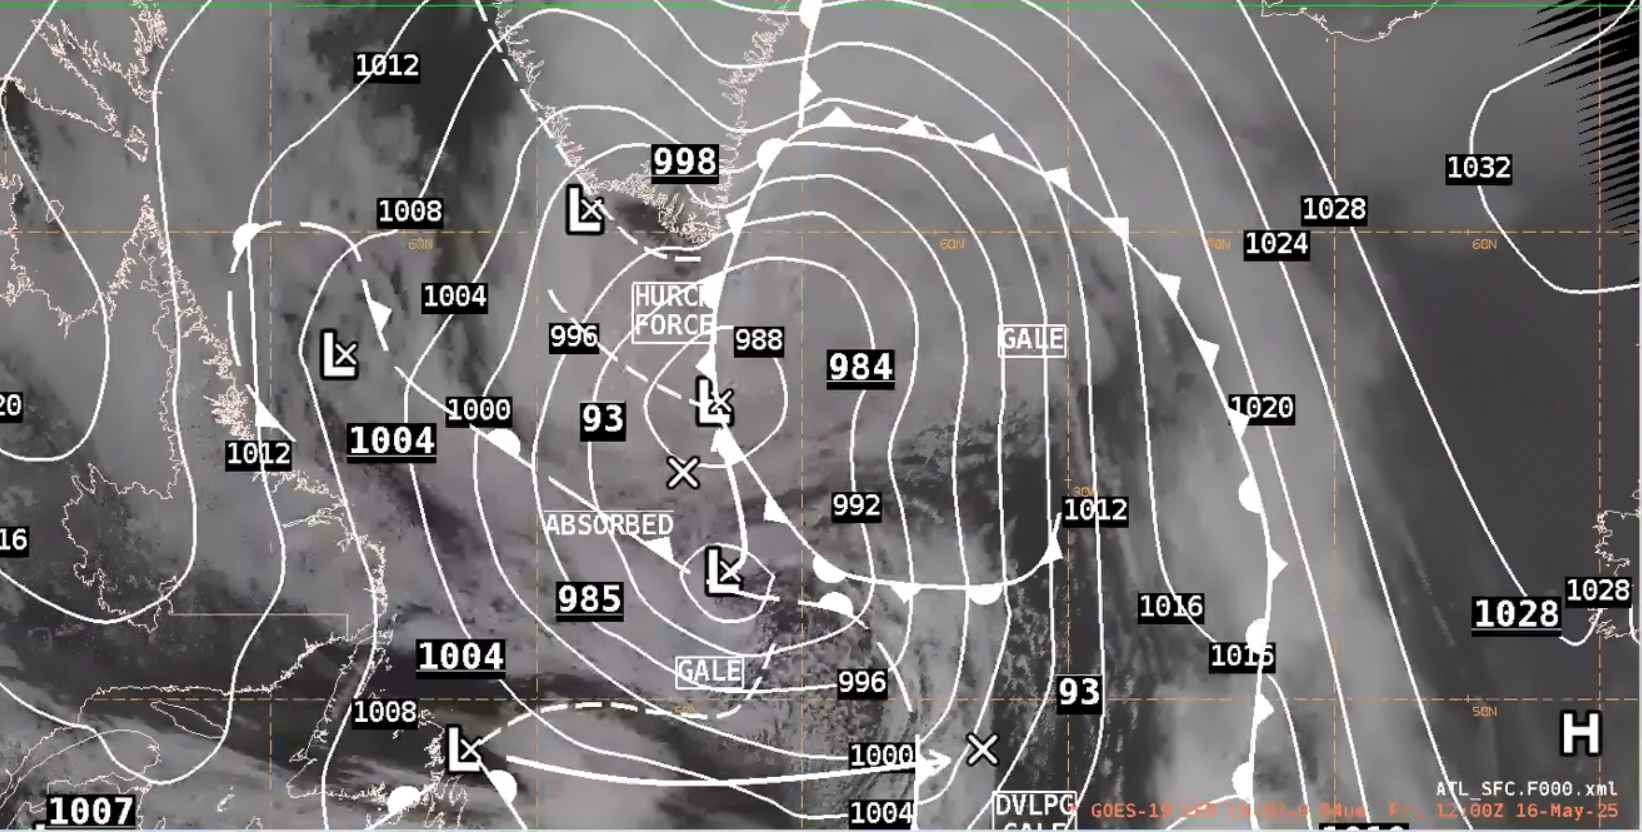
NWS OPC Surface Analysis at 1200 UTC 16 May 2025 confirmed a hurricane-force low, located very close to the North Atlantic 24 Hour Surface Forecast issued the day prior, with a minimum central pressure of 984 mb just south of the tip of Greenland.
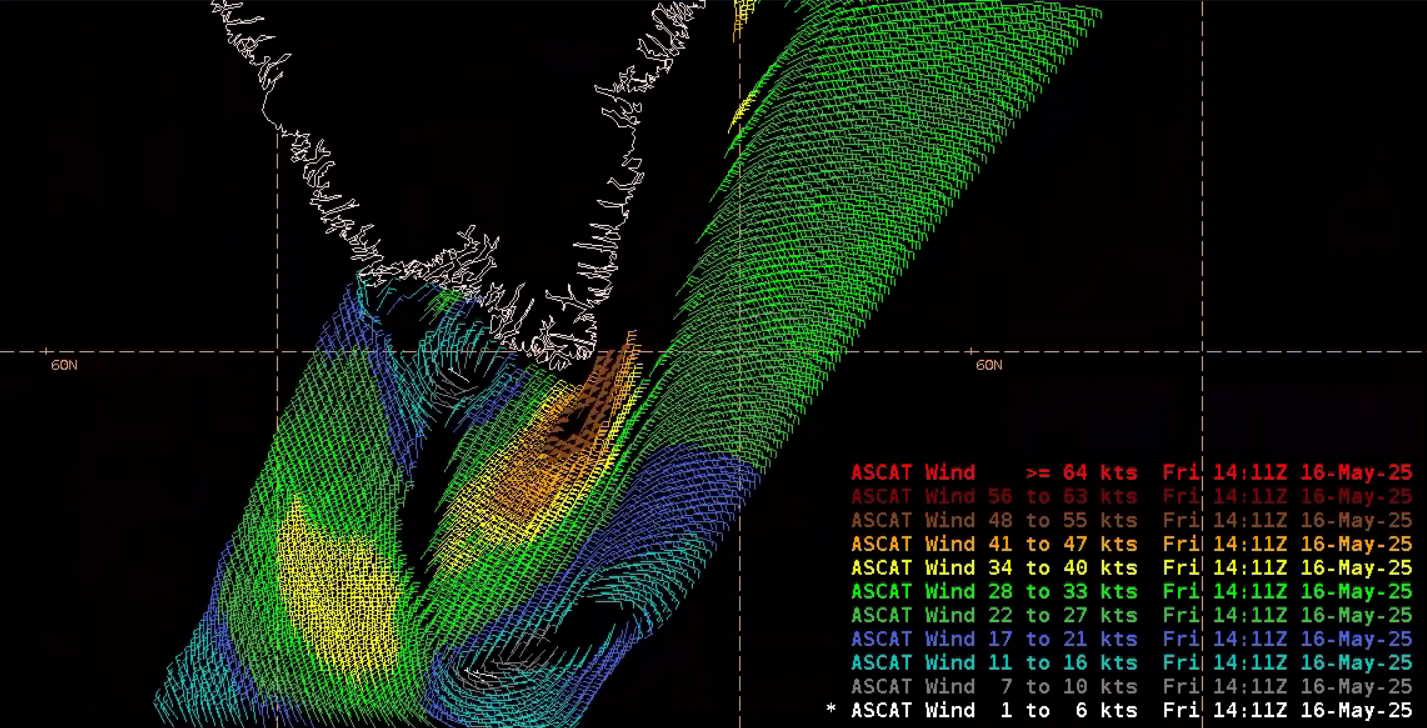
Metop-B and Metop-C ASCAT scatterometer passes from ~1140 to ~1420 UTC 16 May 2025 identified wind speeds in excess of 50 kt. You’ll notice a gap in observations just to the north of the high-wind observations due to the presence of the ice sheet and ASCAT’s ability to only get within 10-20 km of the land/ice.
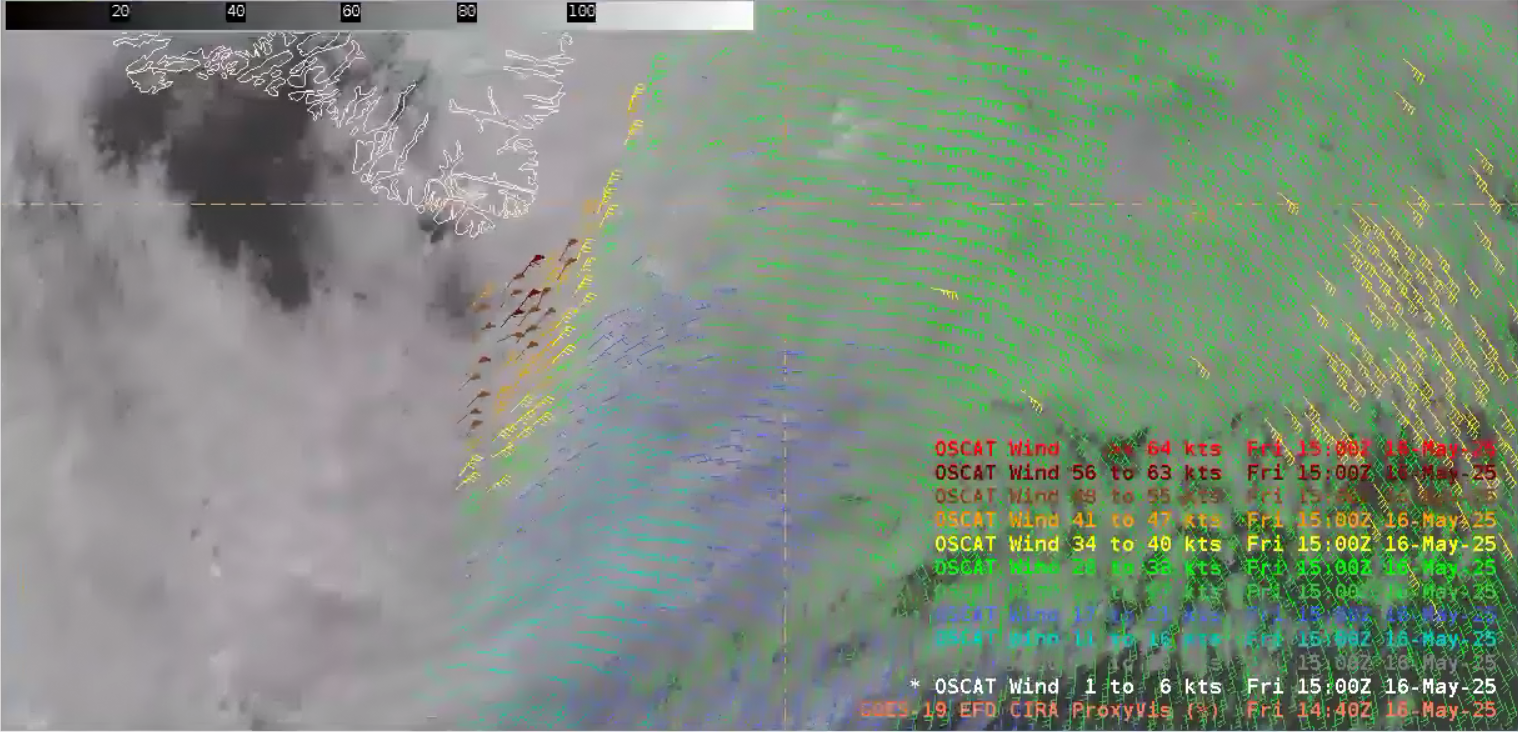
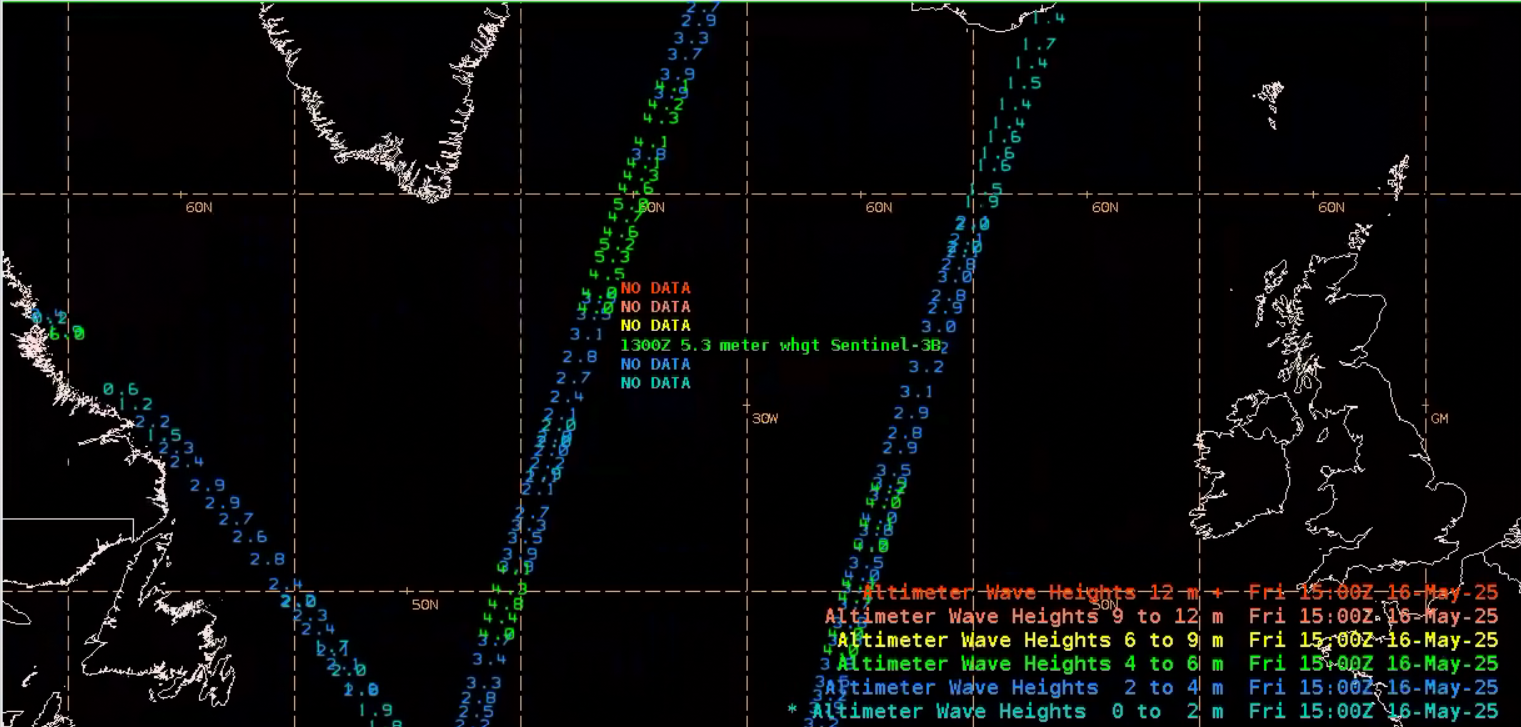
At 1440 UTC, an OSCAT-3 scatterometer pass observed wind speeds very close to hurricane-force, with a 60 kt wind barb located in the same area of high winds as shown in ASCAT. OSCAT-3 is a Ku-band scatterometer, with its shorter wavelength being more sensitive to rain contamination, but it can also detect higher wind speeds than ASCAT in certain scenarios. Wave observations around the time of peak intensity were around 5.3 meters, or over 17 feet.
While the Atlantic Basin is a bit quieter this week, a storm-force low is expected to develop in the Northwest Pacific by Friday.
