University of Maryland

Explosive Atlantic Hurricane-Force Low

UMD/ESSIC/CISESS GOES-R Satellite Liaison for NWS WPC

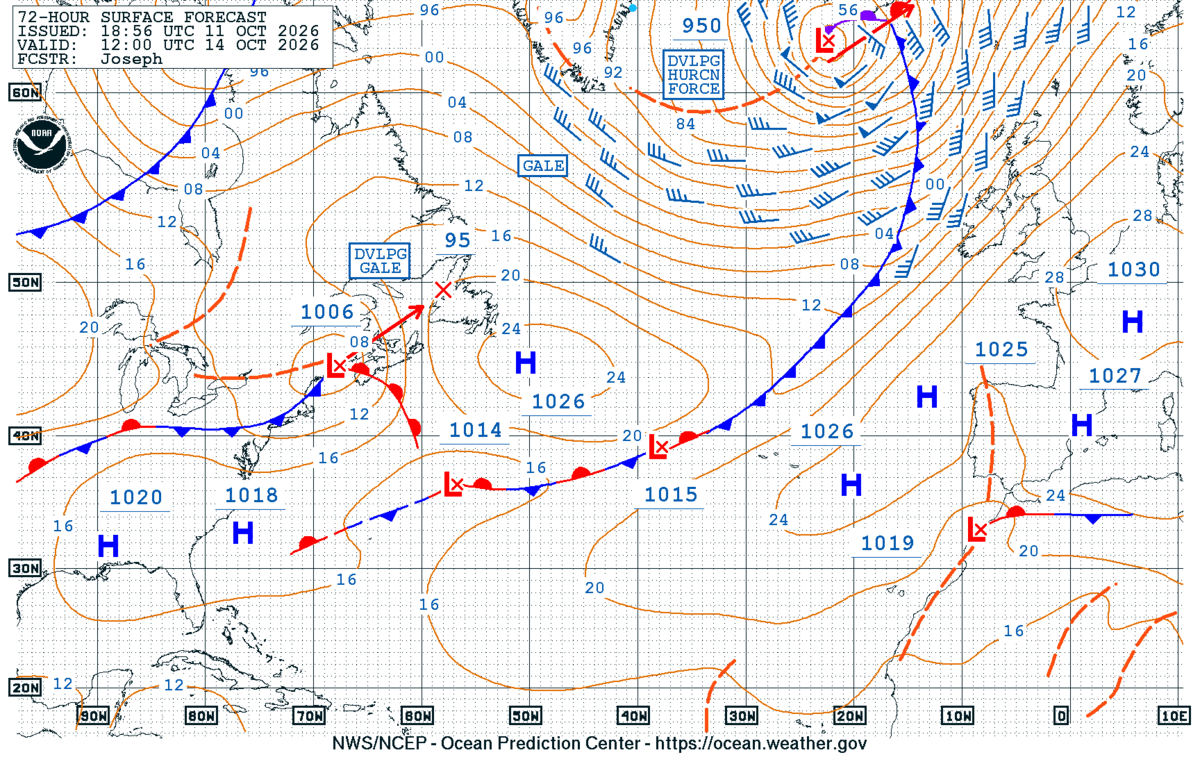
An explosive extratropical cyclone developed last week, achieving hurricane-force (HF) winds while traversing the northeast Atlantic and impacting island nations like Iceland. The NWS Ocean and Tsunami Center (OTC)’s 72 and 96-hour Surface Forecast Charts returned on September 30, and the North Atlantic 72 Hour Surface Forecast valid for 1200 UTC 14 October 2026 highlighted a powerful low pressure system as a developing HF low with a minimum central pressure of 950 mb.

NWS OTC North Atlantic 72-Hour Surface Forecast
Figure 1: NWS OTC North Atlantic 72-Hour Surface Forecast, issued at 1856 UTC 11 October, valid for 1200 UTC 14 October 2026.

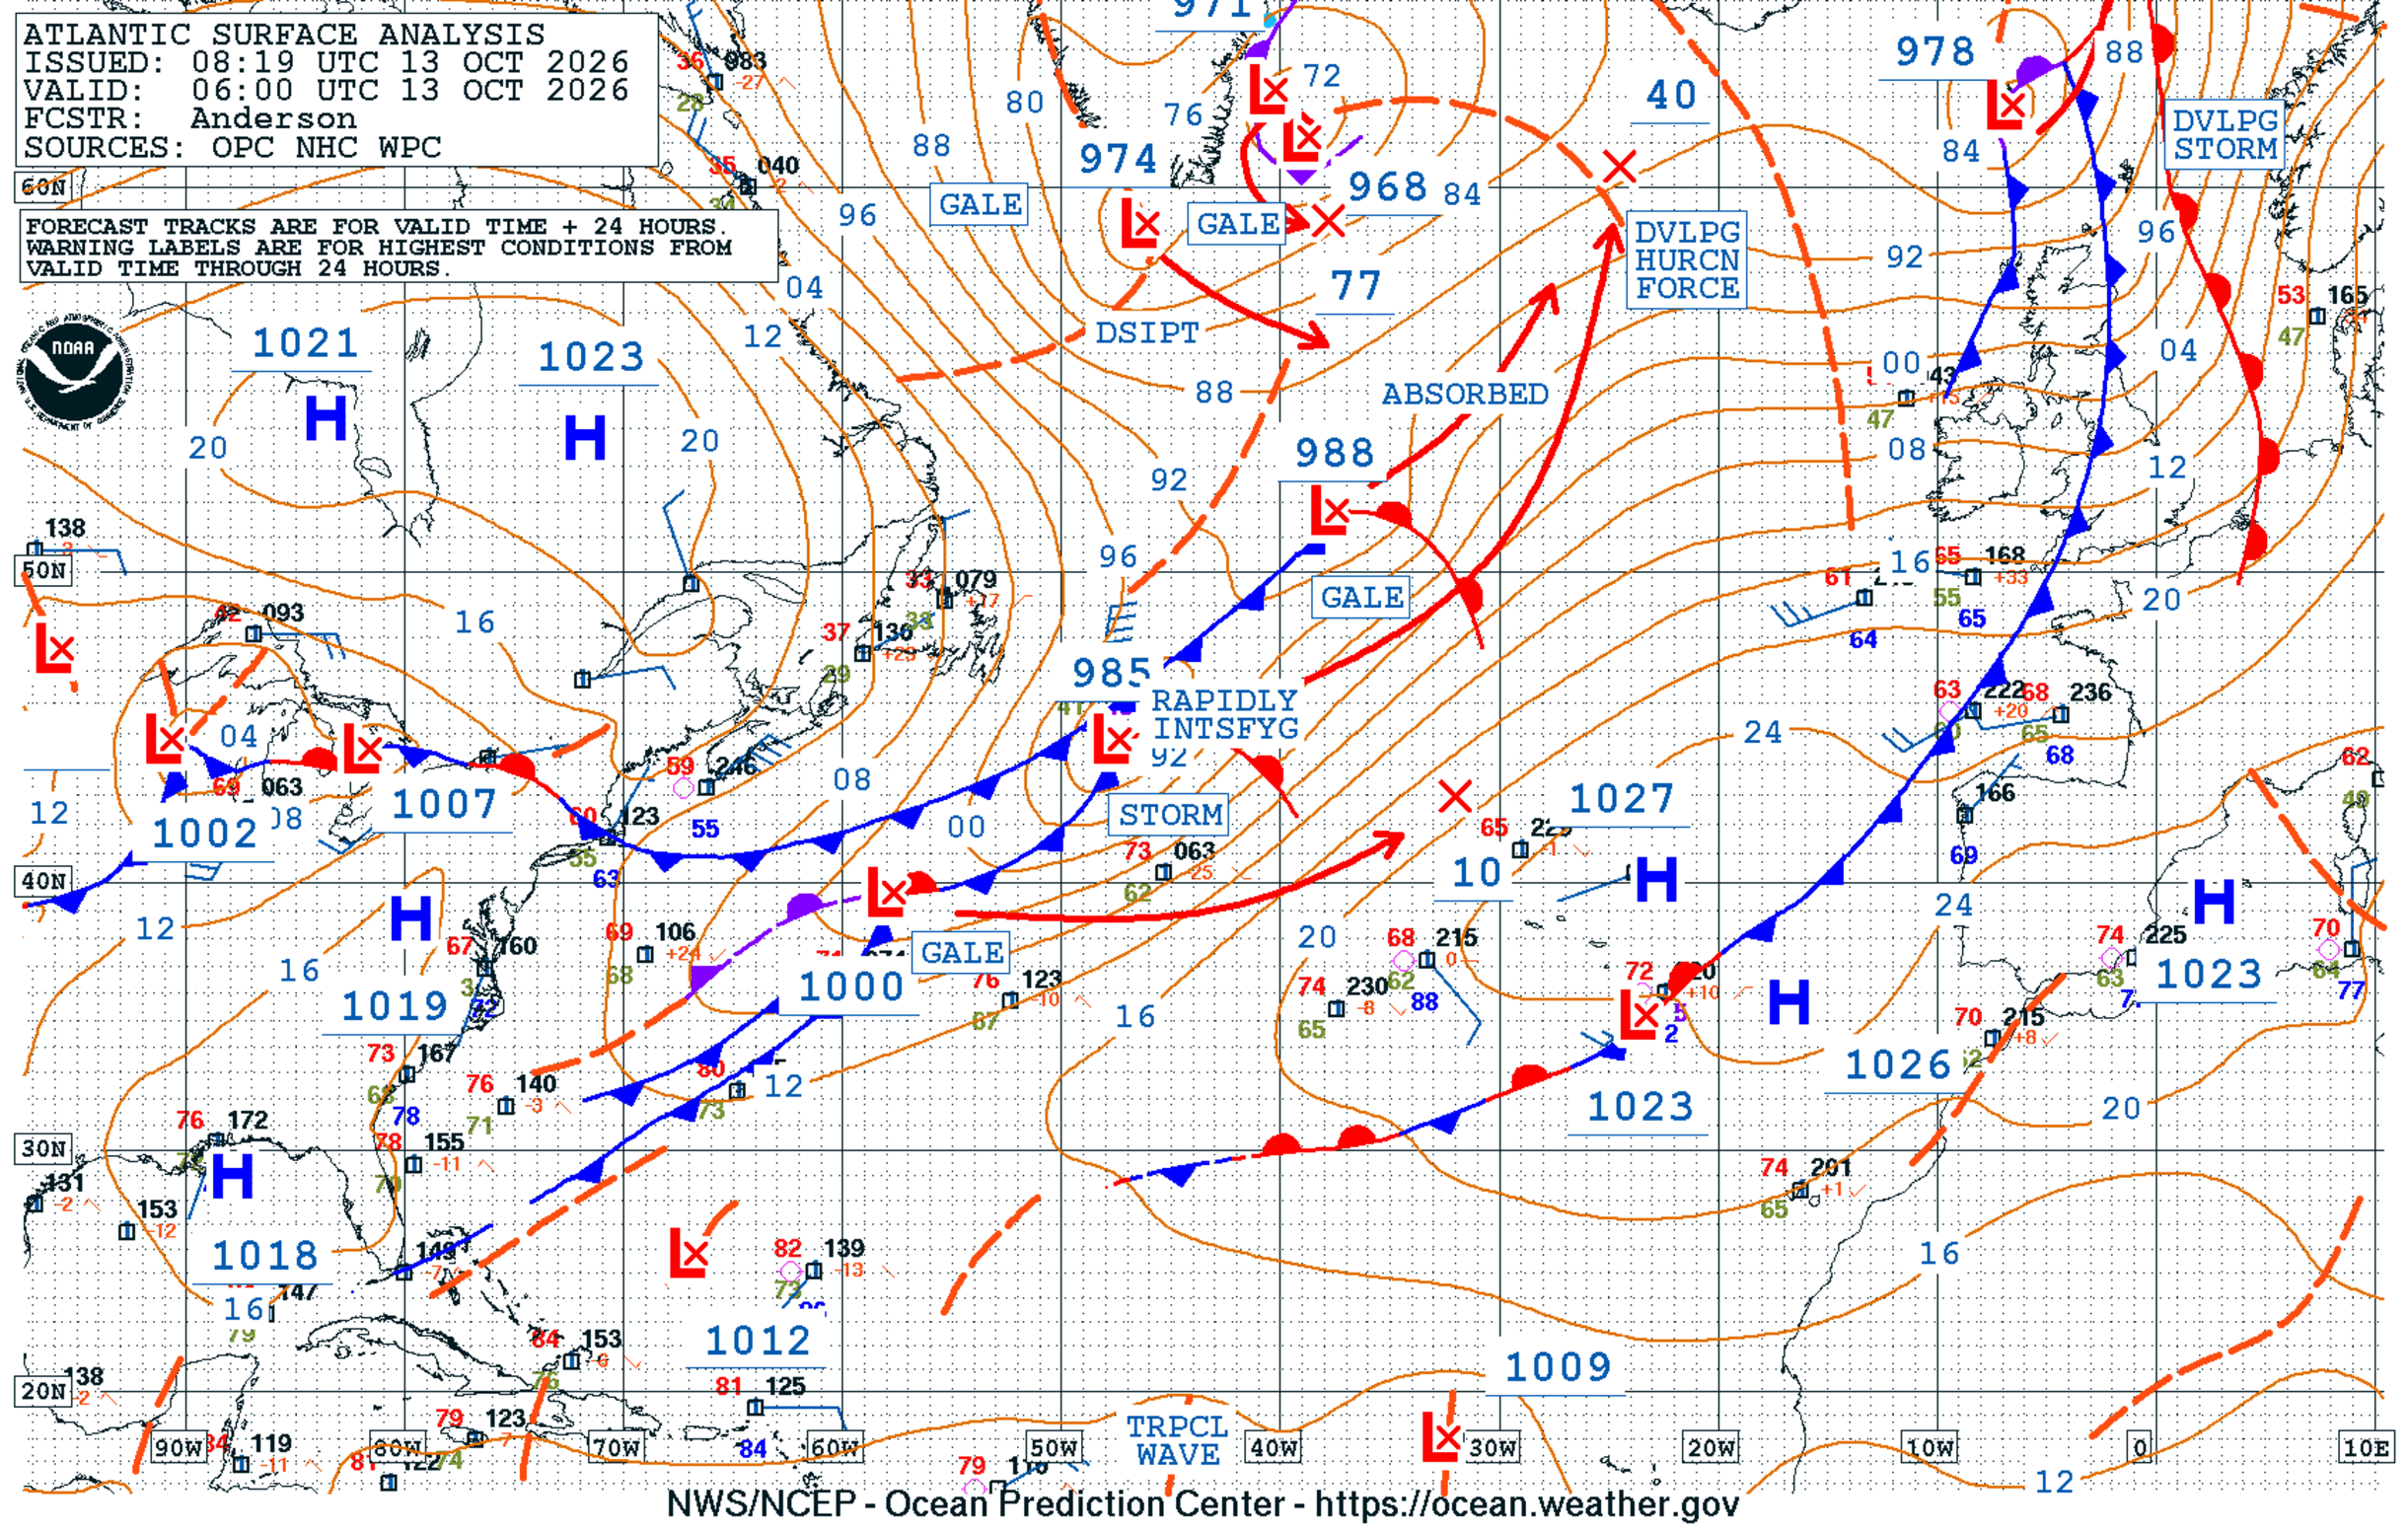
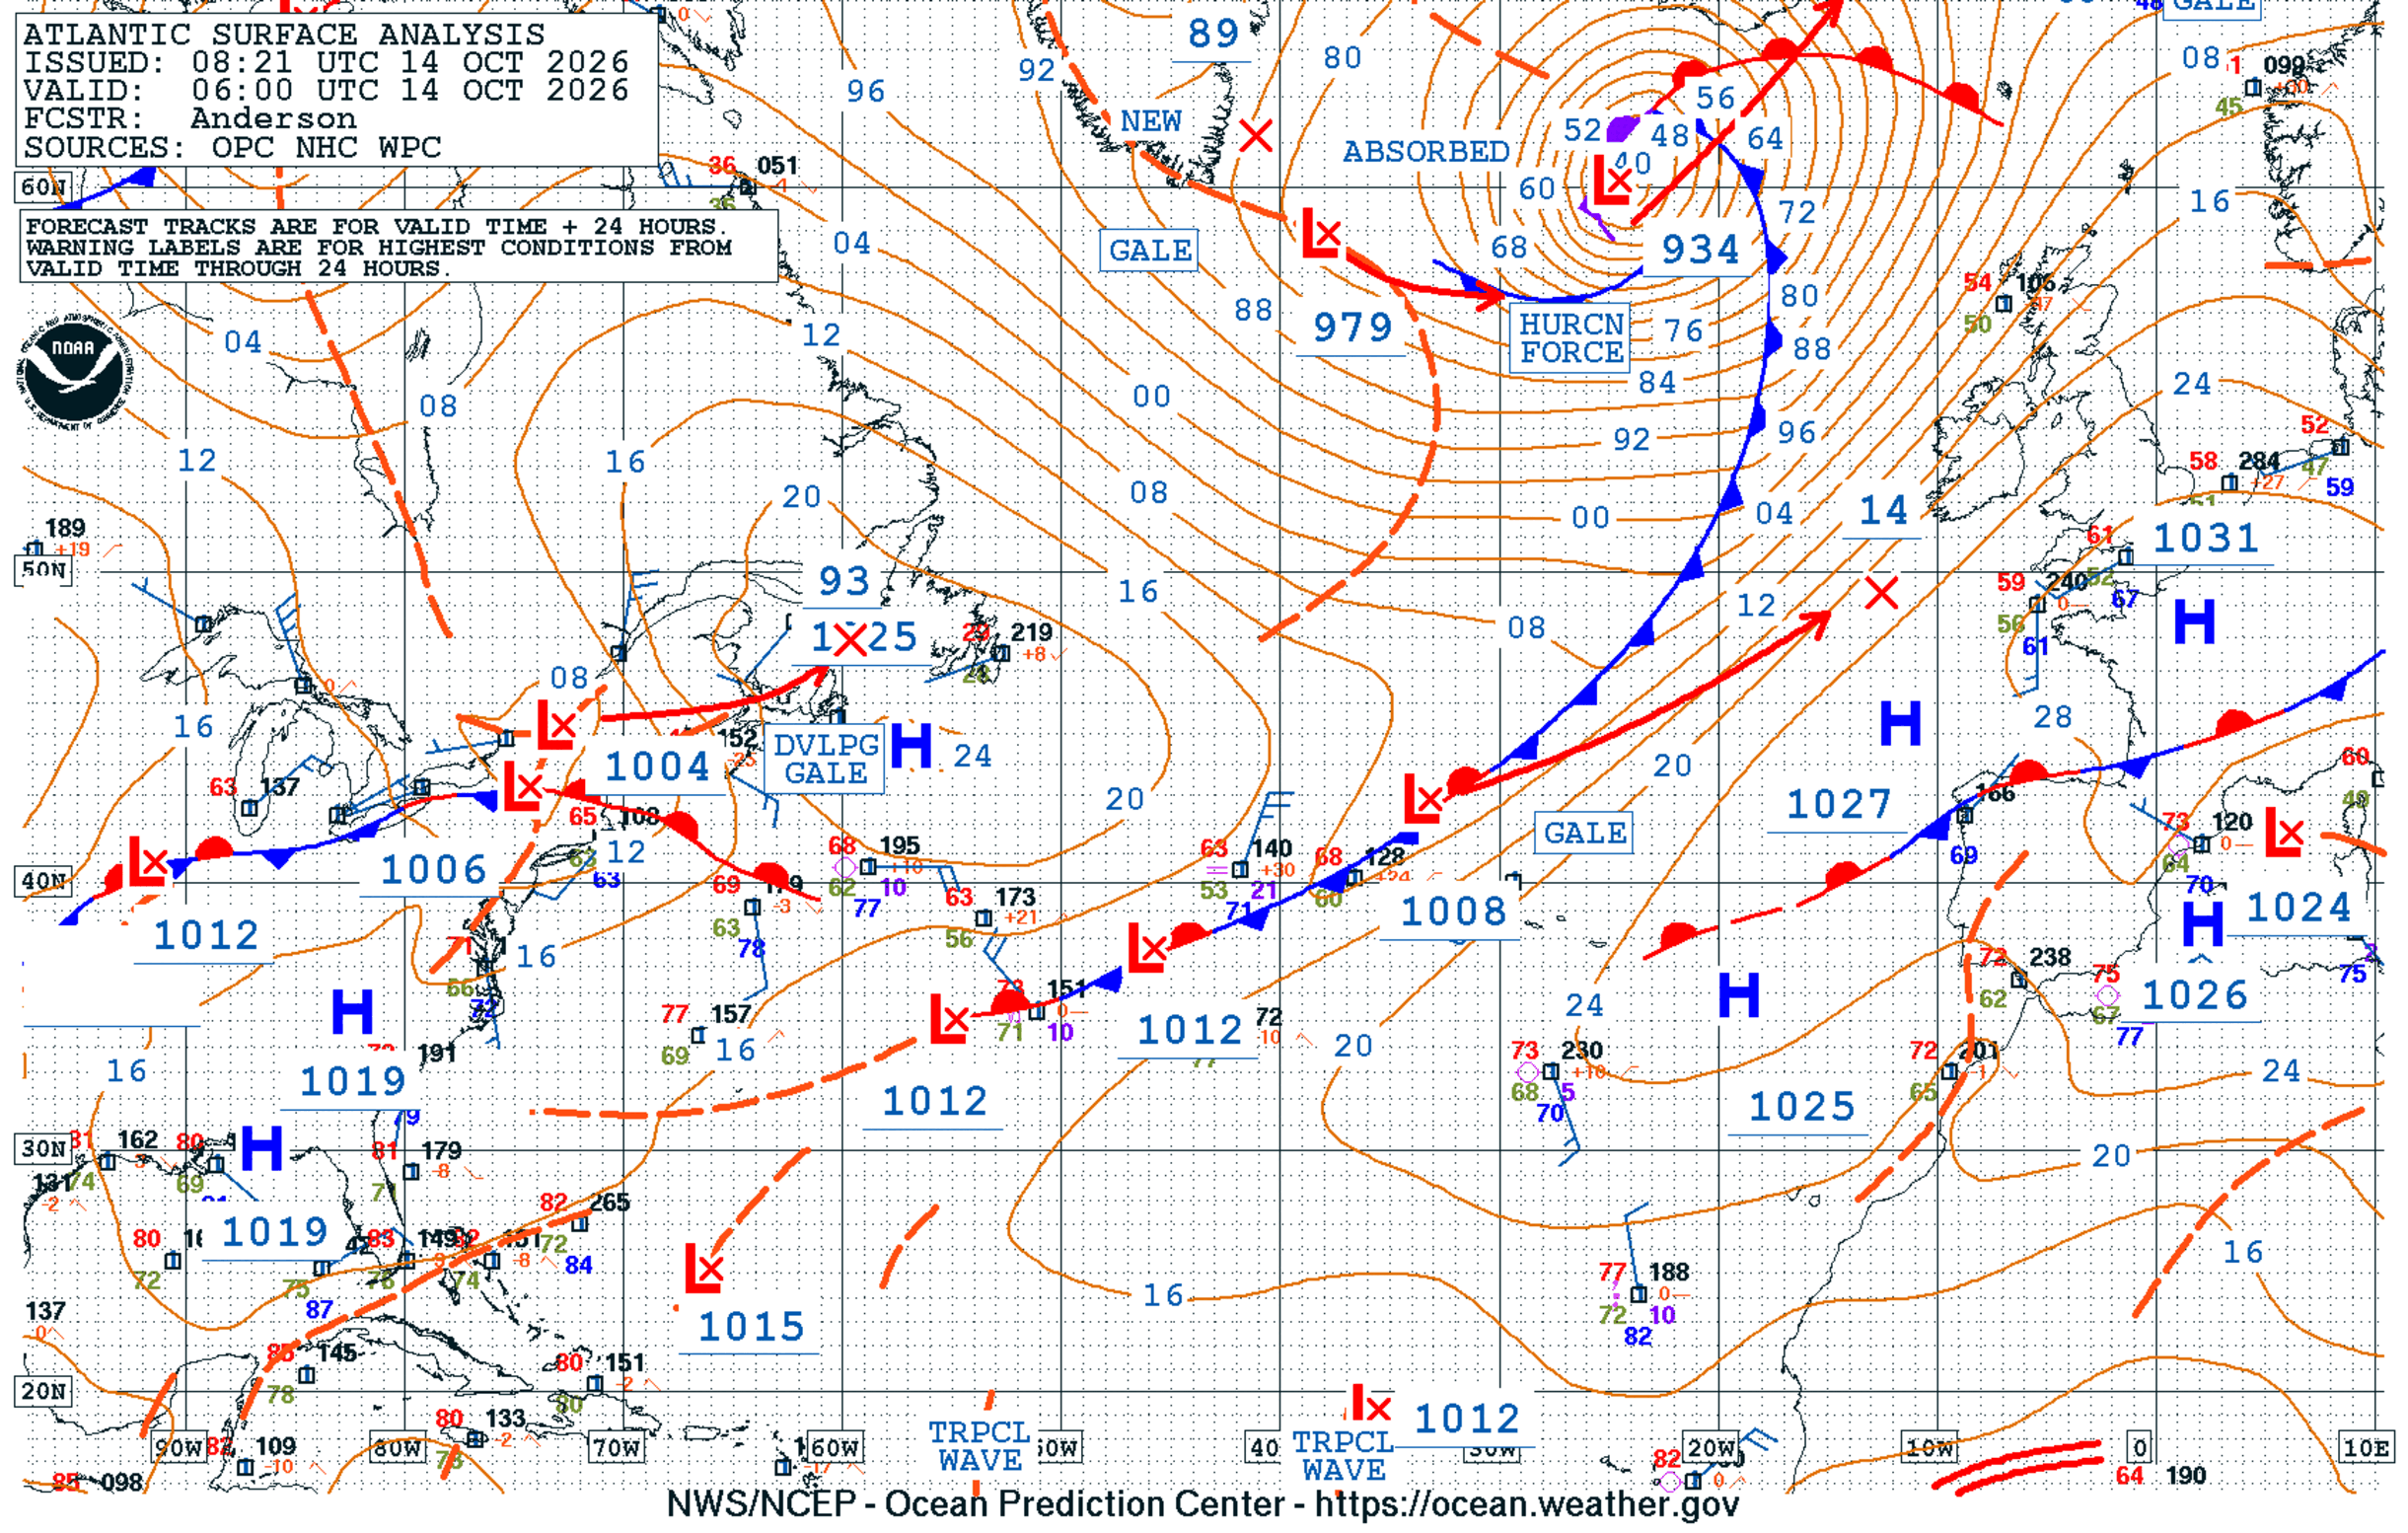
Indeed a HF low was analyzed by OTC on 14 October 2026. The rapid intensification of the system was extremely impressive, with the minimal central pressure plummeting 51 mb in 24 hours!

NWS OTC North Atlantic Surface Analysis

Figure 2: NWS OTC North Atlantic Surface Analysis at 0600 UTC 13 October (left – 985 mb low) and at 0600 UTC 14 October 2026 (right – 934 mb low).

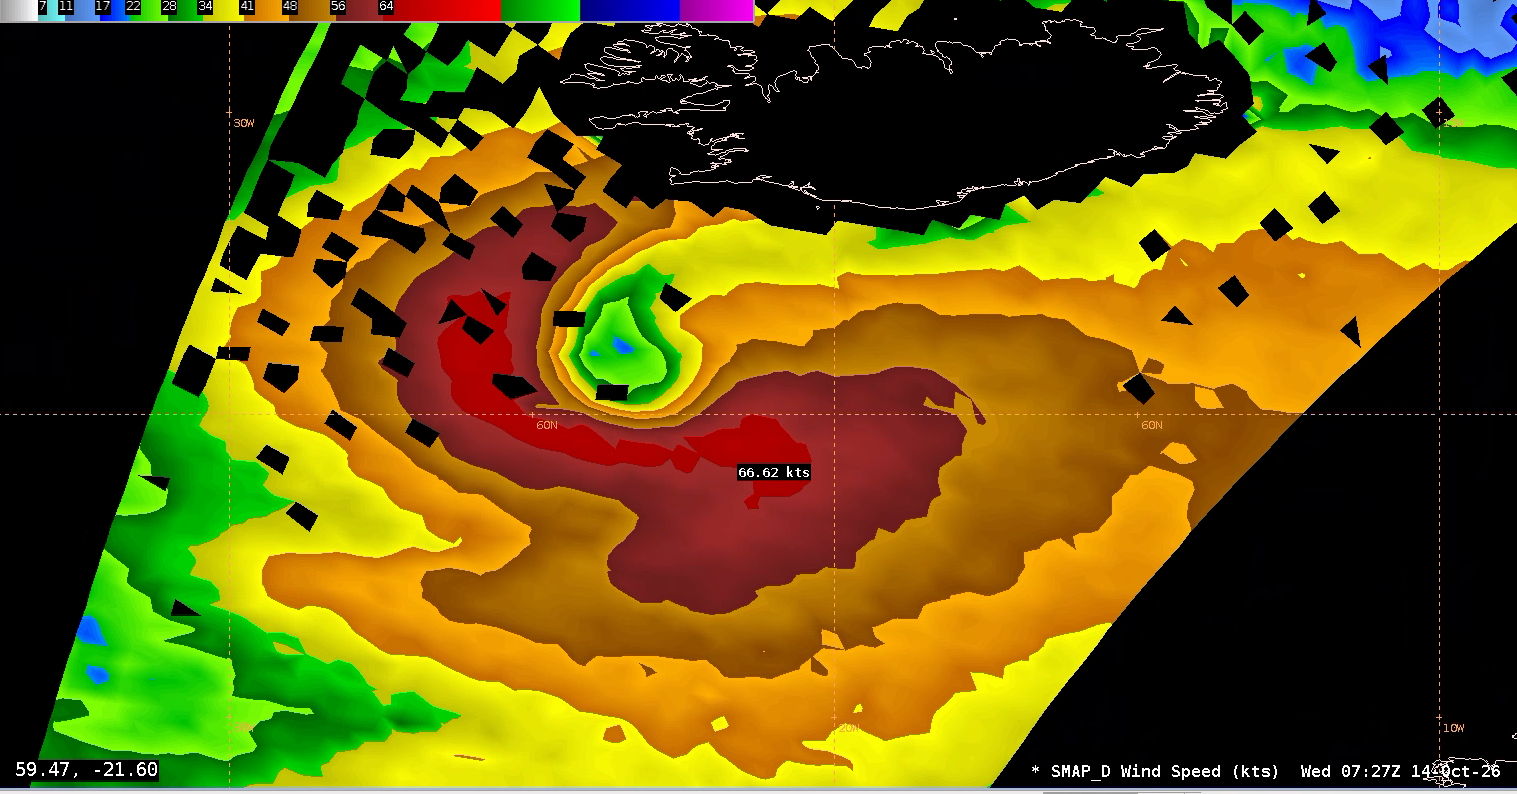
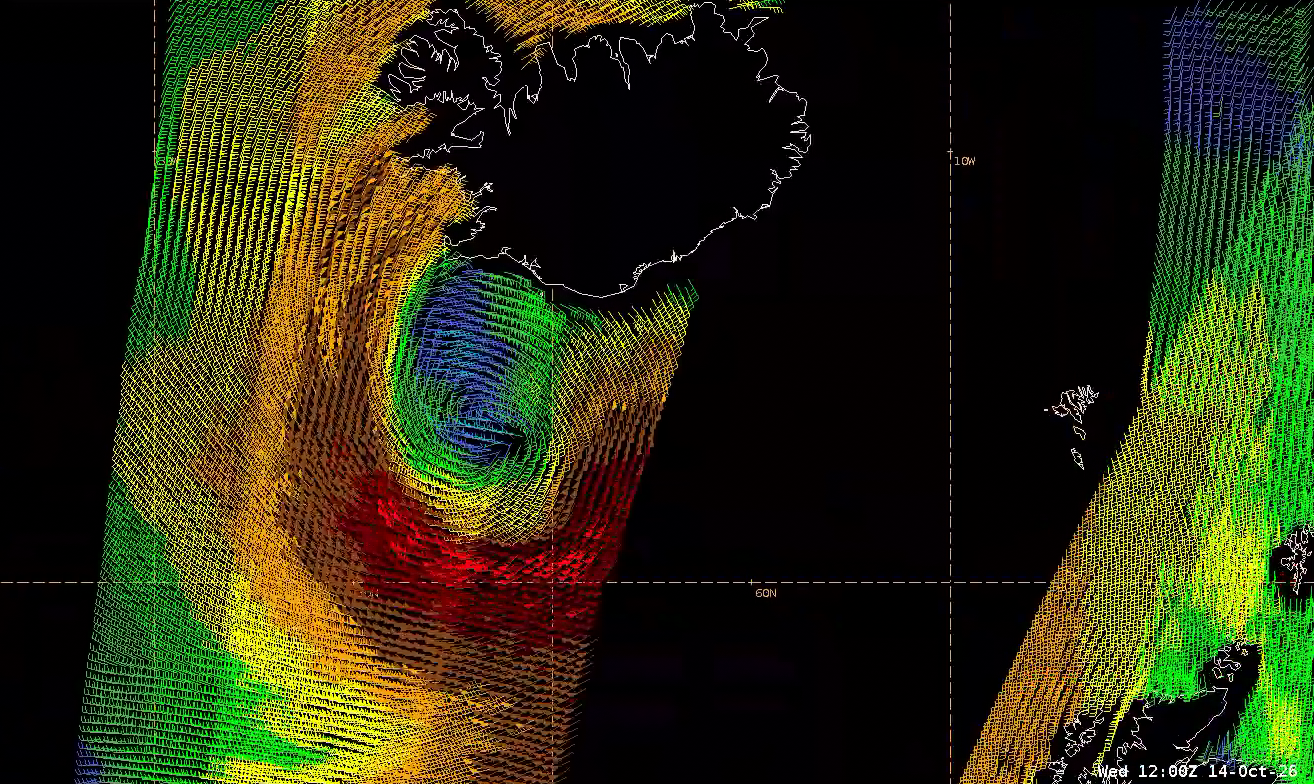
A SMAP overpass shortly after ~0730 UTC October 2026 observed HF winds in the system’s southern and western quadrants, even with its coarse spatial resolution of ~60 km. A Metop-B scatterometer pass at ~1230 UTC confirmed the HF winds in the southern quadrant as the powerful system approached Iceland.

SMAP Winds output
Figure 3: SMAP Winds output at ~0730 UTC 14 October 2026. This image was exported from AWIPS, and display files can be shared upon request.
Metop-B ASCAT
Figure 4: Metop-B ASCAT at ~1230 UTC 14 October 2026. This image was exported from AWIPS, and display files can be shared upon request.

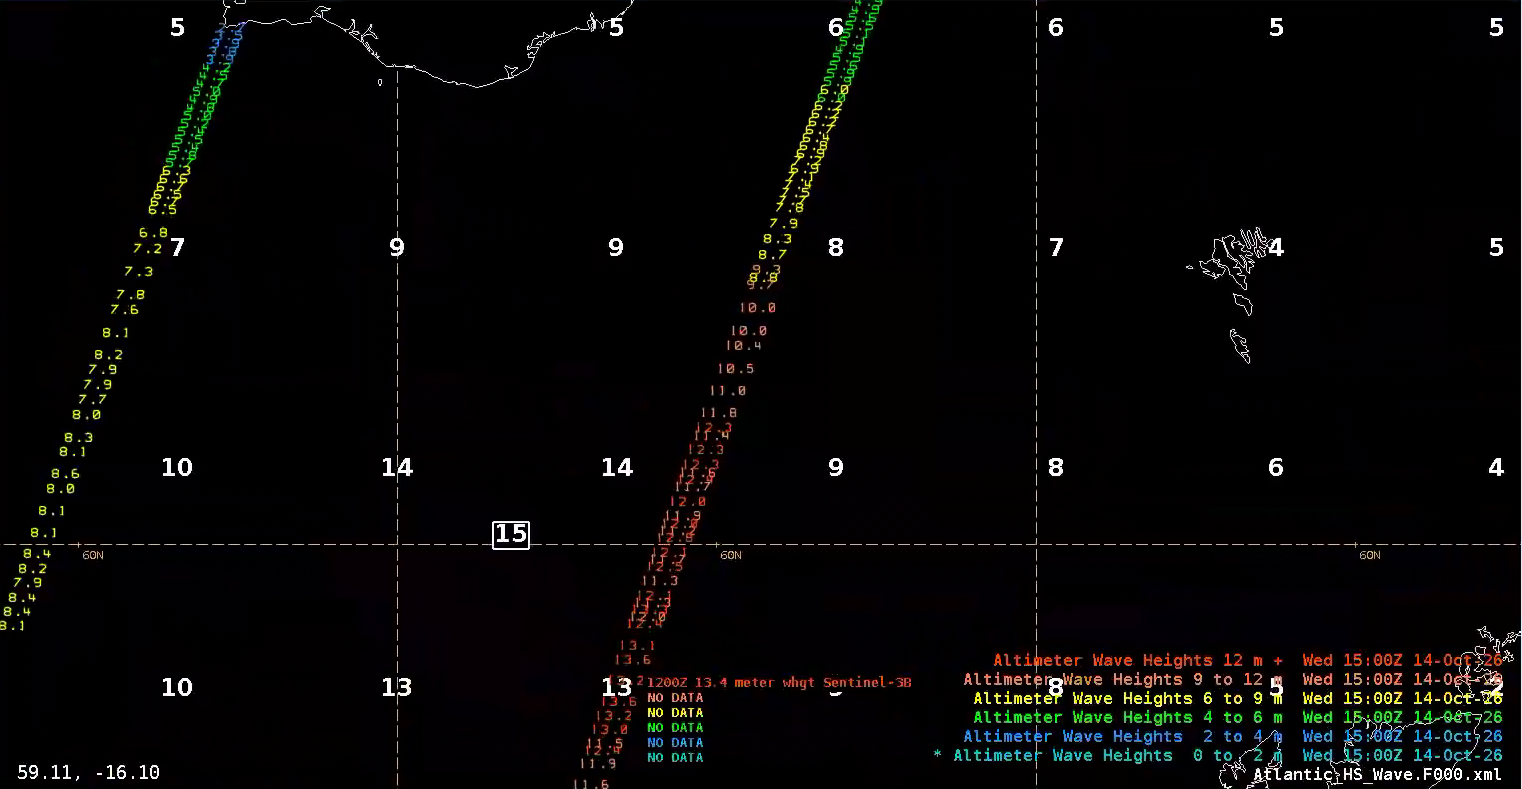
The HF low’s wind field and forward speed generated massive waves. A Sentinel-3B altimeter pass at ~1200 UTC observed significant wave heights exceeding 13 meters, or approaching 45 feet! These observations aligned extremely closely with the OTC 1200 UTC 14 October 2026 North Atlantic Sea State Analysis.

Sentinel-3B/SRAL observations
Figure 5: Sentinel-3B/SRAL observations at ~1200 UTC overlaid on OTC North Atlantic Sea State Analysis. This image was exported from AWIPS, and display files can be shared upon request.

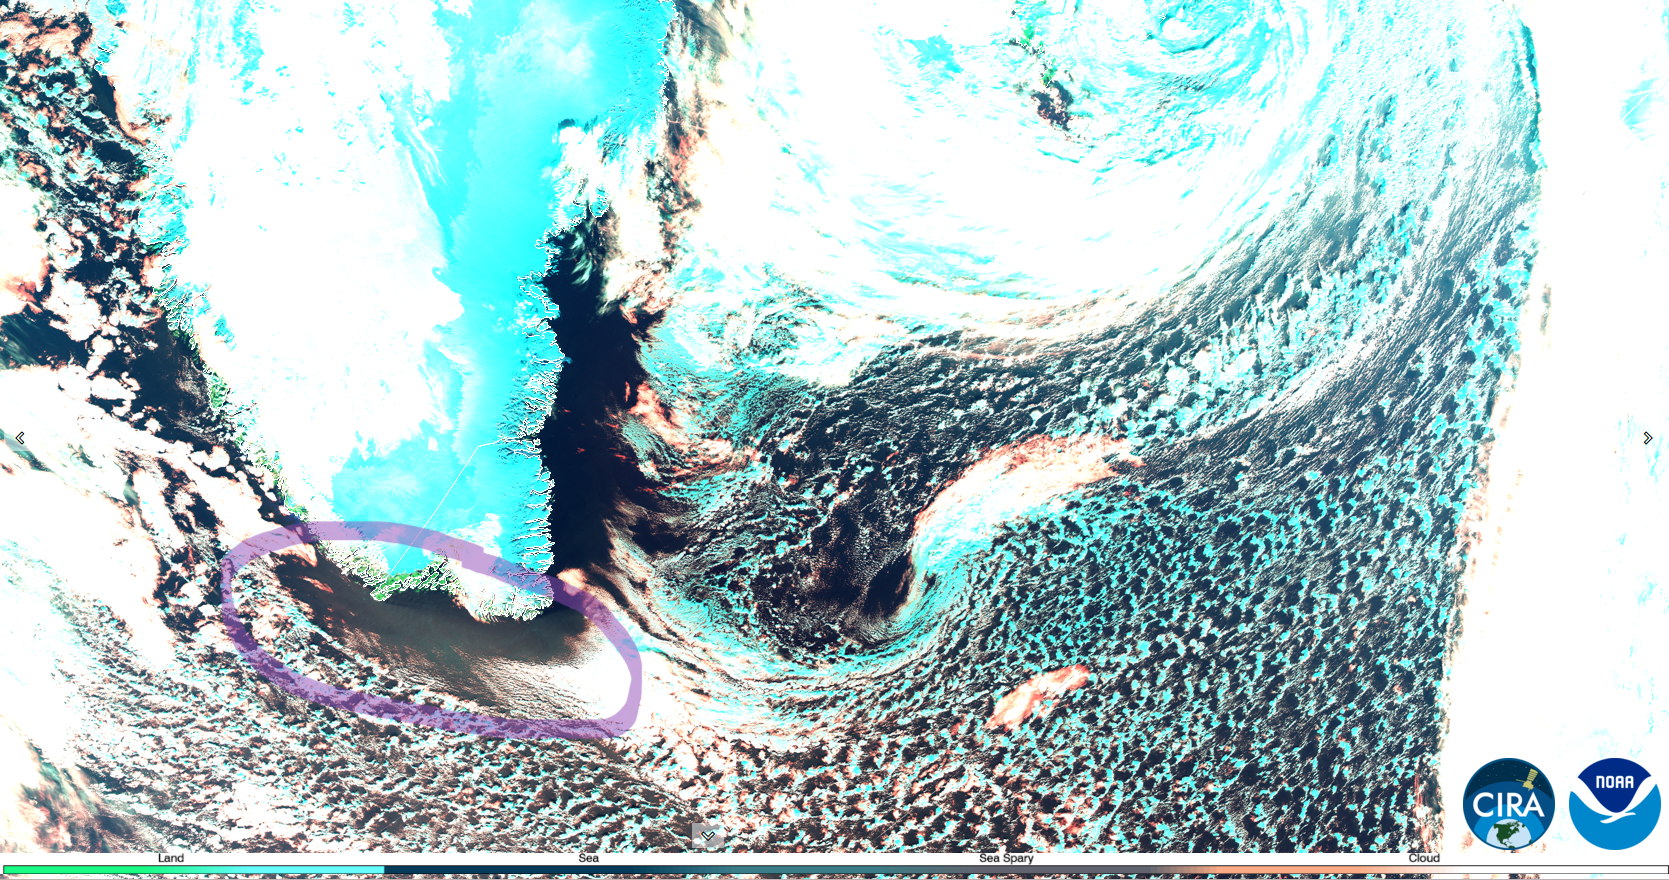
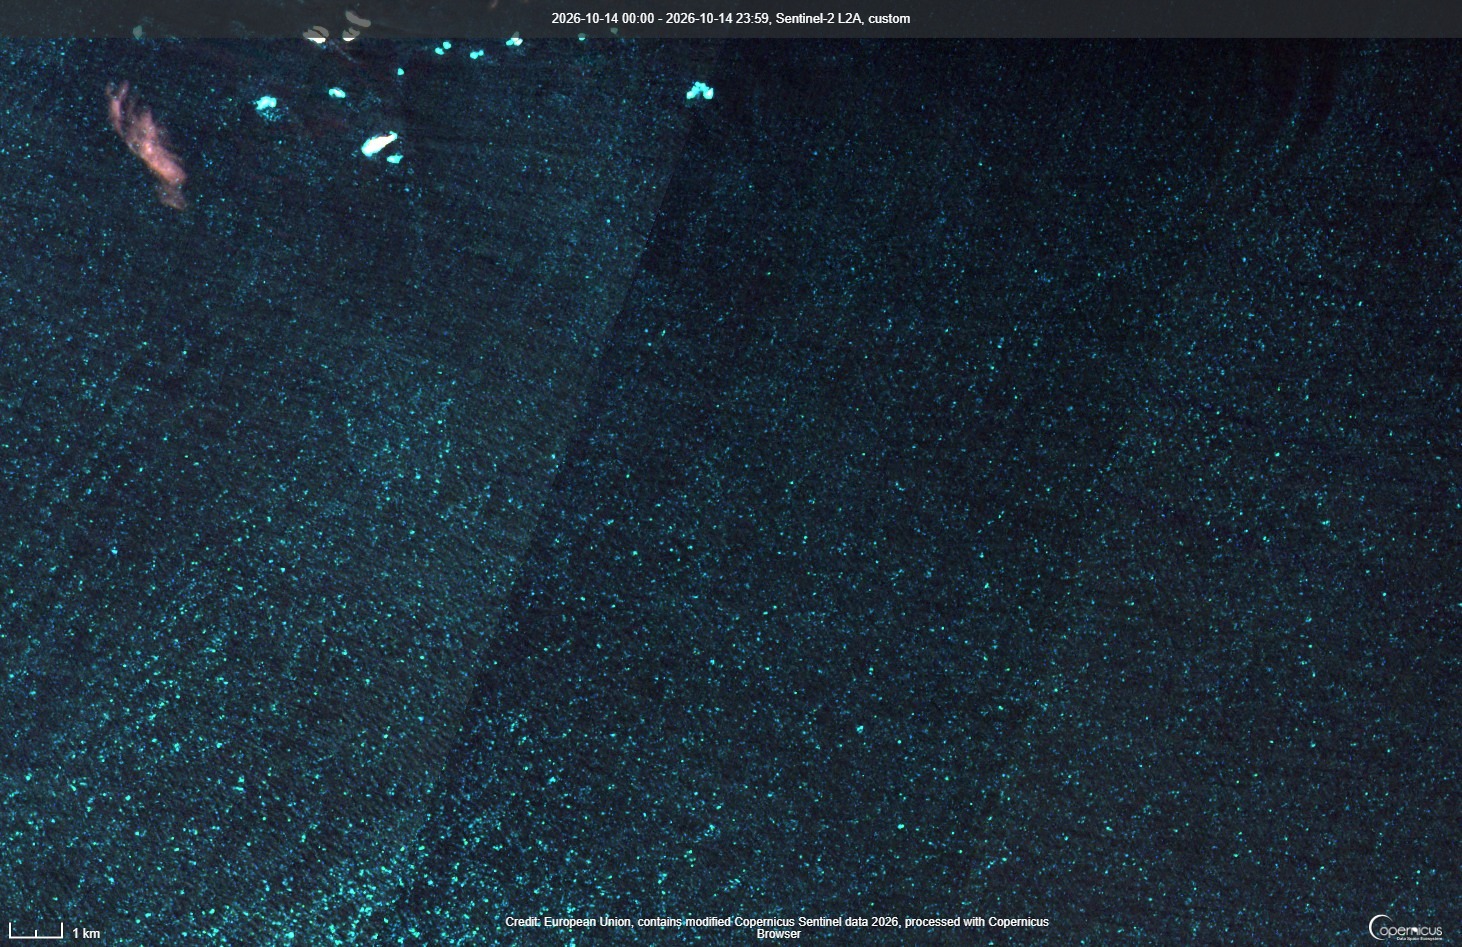
Gale-force winds were found as far west as the southern tip of Greenland, likely causing sea spray to form. Sea spray showed up as the medium cyan to gray color upstream of cloud streets in a JPSS pass at ~1530 UTC. This was confirmed in very high 10-20 m spatial resolution Sentinel-2 Sea Spray RGB imagery from about ~1 hour earlier, with white caps and sea spray clearly visible. The JPSS Sea Spray RGB can be found on CIRA Slider.

JPSS Sea Spray RGB output
Figure 6: JPSS Sea Spray RGB output at ~1530 UTC 14 October 2026, with the location of sea spray circled in purple. From CIRA Slider
Sentinel-2 Sea Spray
Figure 7: Sentinel-2 Sea Spray RGB output at ~1430 UTC 14 October 2026. Sentinel-2 imagery from: https://dataspace.copernicus.eu/browser/

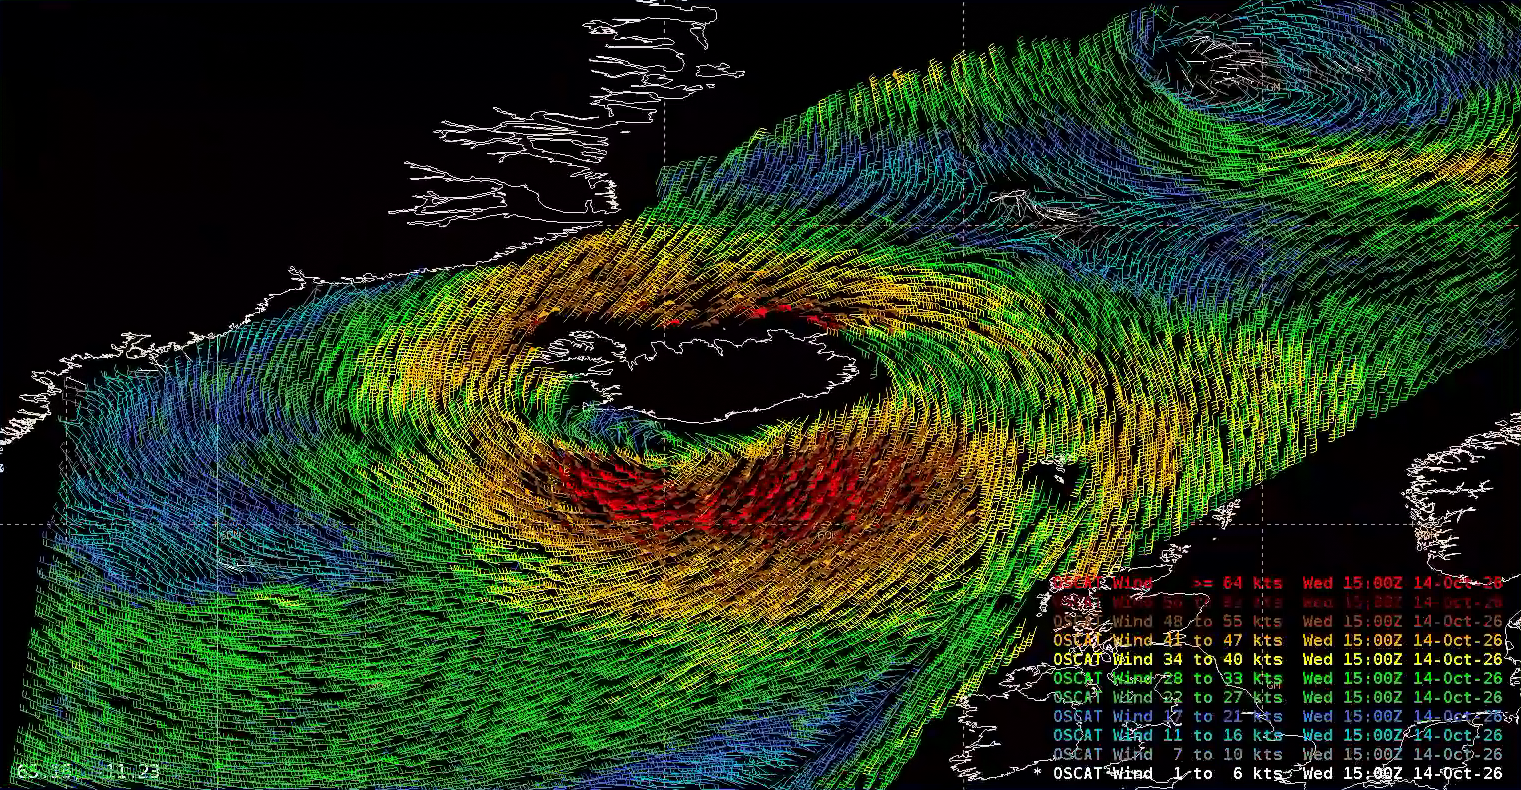
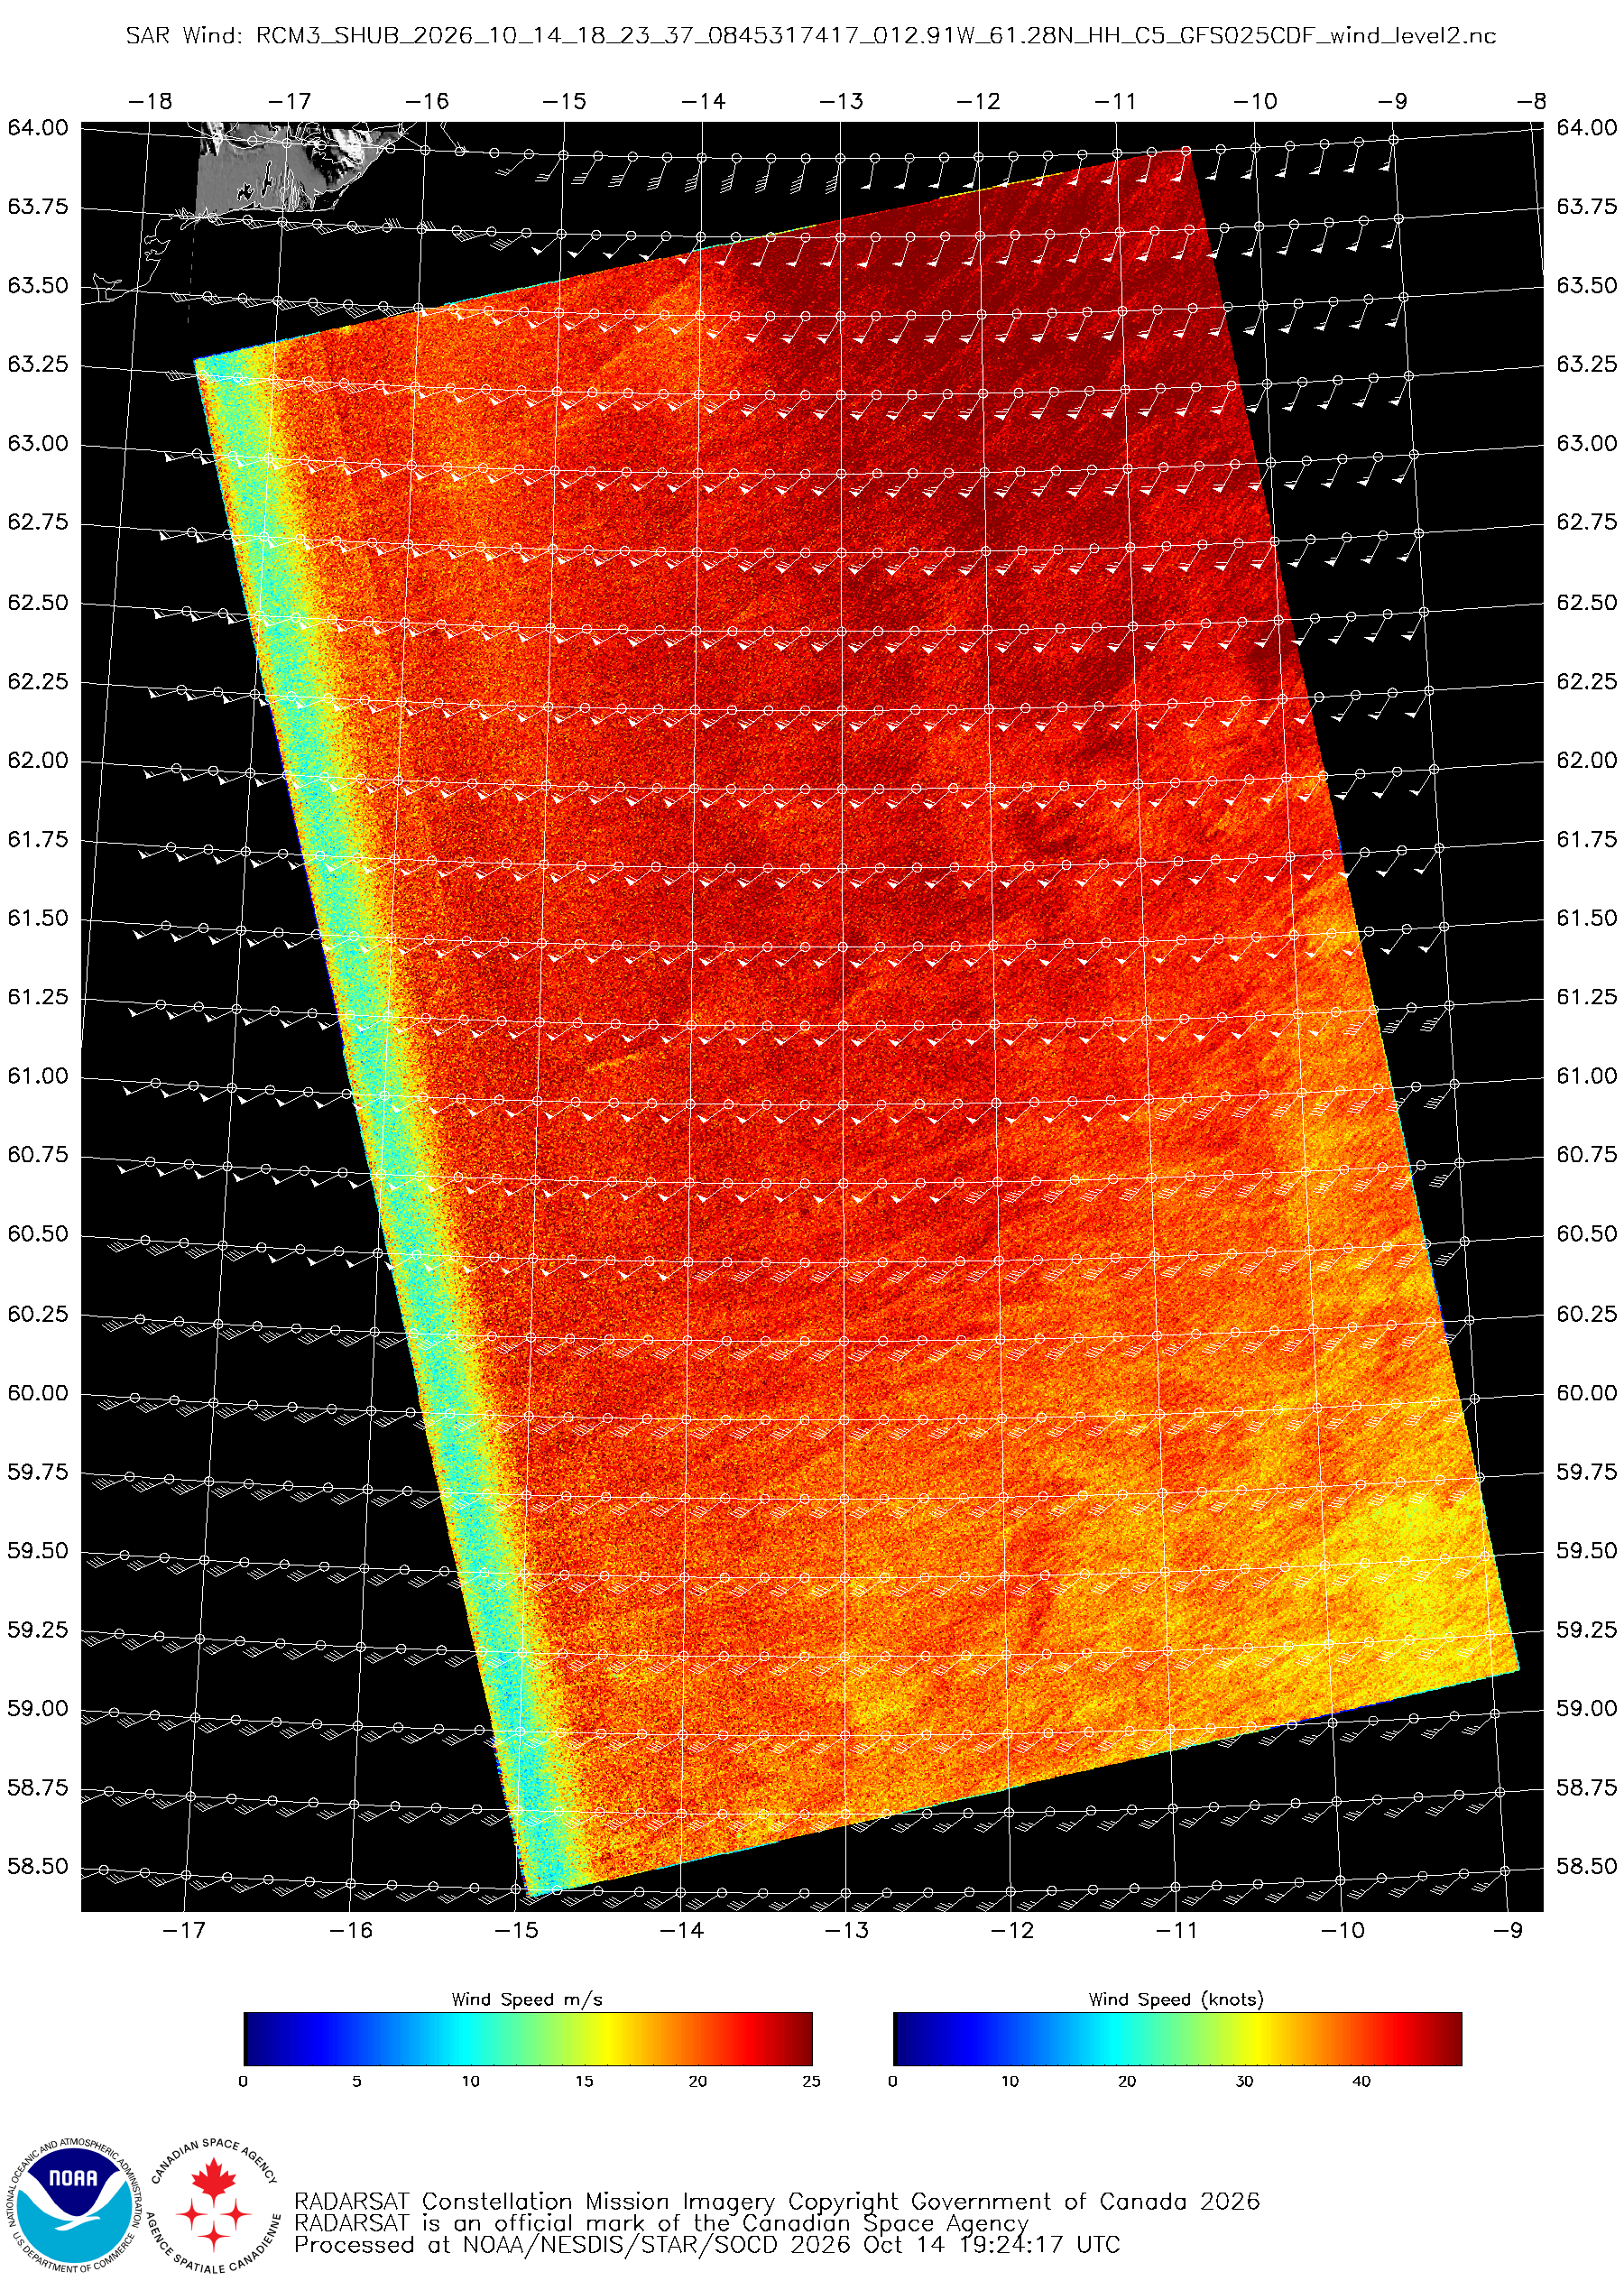
An OSCAT-3 pass at ~1600 UTC captured the extratropical cyclone as it moved overhead of Iceland, with HF winds observed both north and south of the island. A Synthetic Aperture Radar (SAR) pass from the RADARSAT Constellation Mission-3 (RCM-3) at ~1820 UTC also observed HF winds at 500-m resolution southeast of Iceland.

OSCAT-3 scatterometer
Figure 8: OSCAT-3 scatterometer pass at ~1600 UTC 14 October 2026. This image was exported from AWIPS, and display files can be shared upon request.
RCM3 SAR Winds imagery
Figure 9: RCM3 SAR Winds imagery valid ~1820 UTC 14 October 2026. RADARSAT Constellation Mission Imagery Copyright Government of Canada 2026. RADARSAT is an official mark of the Canadian Space Agency. Credit: NESDIS/STAR

The Meteosat Third Generation (MTG) Air Mass RGB imagery captured the explosive development of the extratropical cyclone as a digging upper-level trough interacted with the subtropical jet to fuel cyclogenesis. Very dry upper-levels, indicating a low tropopause, are seen in the deep oranges and reds as potential vorticity helped tighten the system’s core.

Figure 10: MTG/FCI Air Mass RGB imagery from 1220 UTC 13 October – 1210 UTC 14 October 2026. This video was exported from AWIPS, and display files can be shared upon request.

Picture of Christopher Smith

Christopher Smith

Christopher Smith joined ESSIC/CISESS, University of Maryland in 2023 and is the GOES-R Satellite Liaison to the NWS Weather Prediction Center and Ocean and Tsunami Center. Smith works to interpret experimental satellite imagery and products, and make such products available to forecasters and the NWS for a route to operations. He trains forecasters how to use satellite imagery in weather forecasting, while also delivering forecaster feedback to satellite developers to maximize meteorological satellite capabilities. Smith is an alumni of the UMD Atmospheric & Oceanic Science (AOSC) Department, and his long-term interests include infusing AI-Satellite Products to increase lead time in decision making for forecasters.