University of Maryland

Hurricane Isaias Strikes Gulf Coast

UMD/ESSIC/CISESS GOES-R Satellite Liaison for NWS WPC

The NWS National Hurricane Center (NHC) designated Isaias as a tropical storm at 0900 UTC 07 October 2026. From 08 October to 09 October Isaias underwent a period of rapid intensification (RI), with maximum sustained winds increasing from 85 mph at 1500 UTC 08 October to 120 mph at 1220 UTC 09 October 2026. GOES-East Full Disk (FD) Band 13 Clear Infrared (IR) Window imagery captured the RI, with the core of the system transforming from more disorganized to having a well-defined eye by the morning of 09 October.

Figure 1: GOES-East FD IR imagery from 1300 UTC 08 October – 1230 UTC 09 October 2026. This video was exported from AWIPS, and display files can be shared upon request.

GOES-East FD Proxyvis also provided a view of the hurricane as it approached the FL Gulf Coast. Proxyvis is meant to mimic GOES Visible Band 02 at night over warm waters, providing an uninterrupted view of low clouds to easily identify a system’s center of circulation.

Figure 2: GOES-East FD Proxyvis imagery from 1500 UTC 08 October – 1500 UTC 09 October 2026. This video was exported from AWIPS, and display files can be shared upon request.

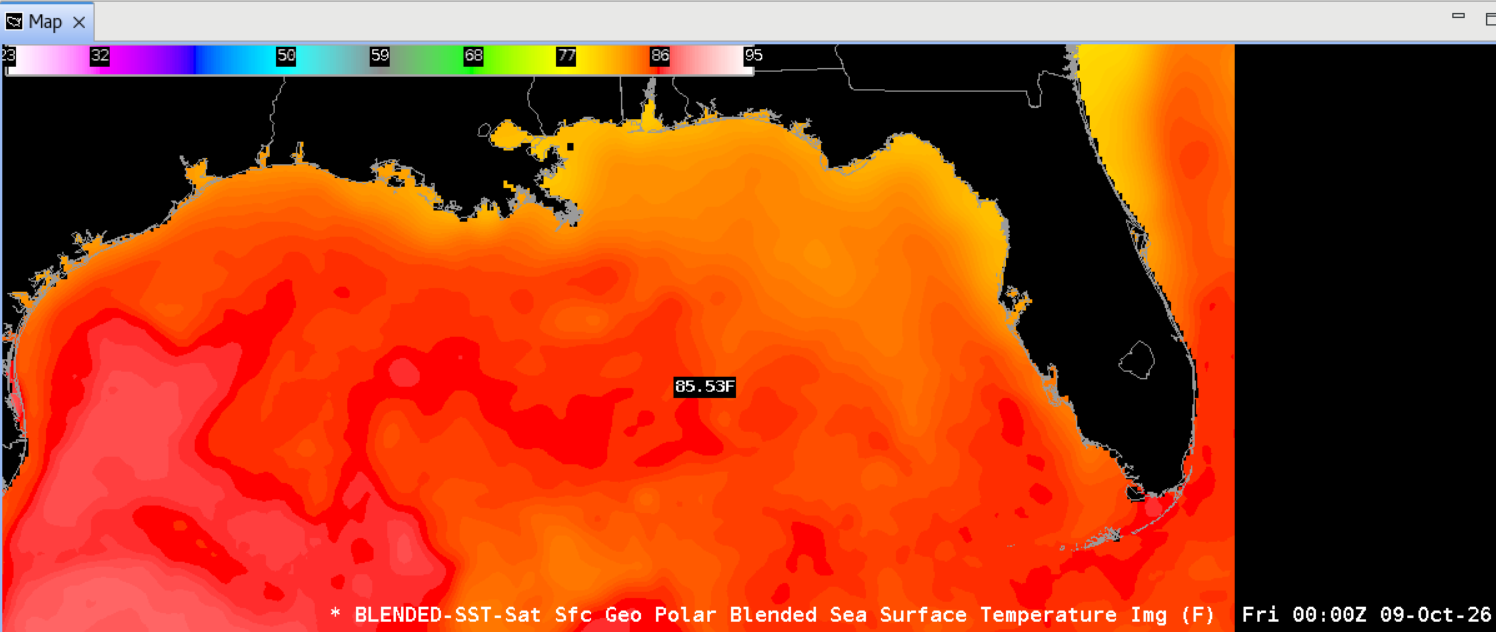
The RI was partially fueled by a localized region of enhanced sea surface temperatures (SSTs). The NESDIS GeoPolar Blended SST product observed SSTs exceeding 85 degrees F where Hurricane Isaias tracked overnight heading into 09 October 2026, while SSTs were slightly cooler to the south and near the Gulf Coast, in the lower 80s. The NESDIS GeoPolar Blended SST Product is now configurable for AWIPS.

Figure 3: NESDIS GeoPolar Blended SST output at 0000 UTC 09 October 2026. This image was exported from AWIPS, and display files can be shared upon request.

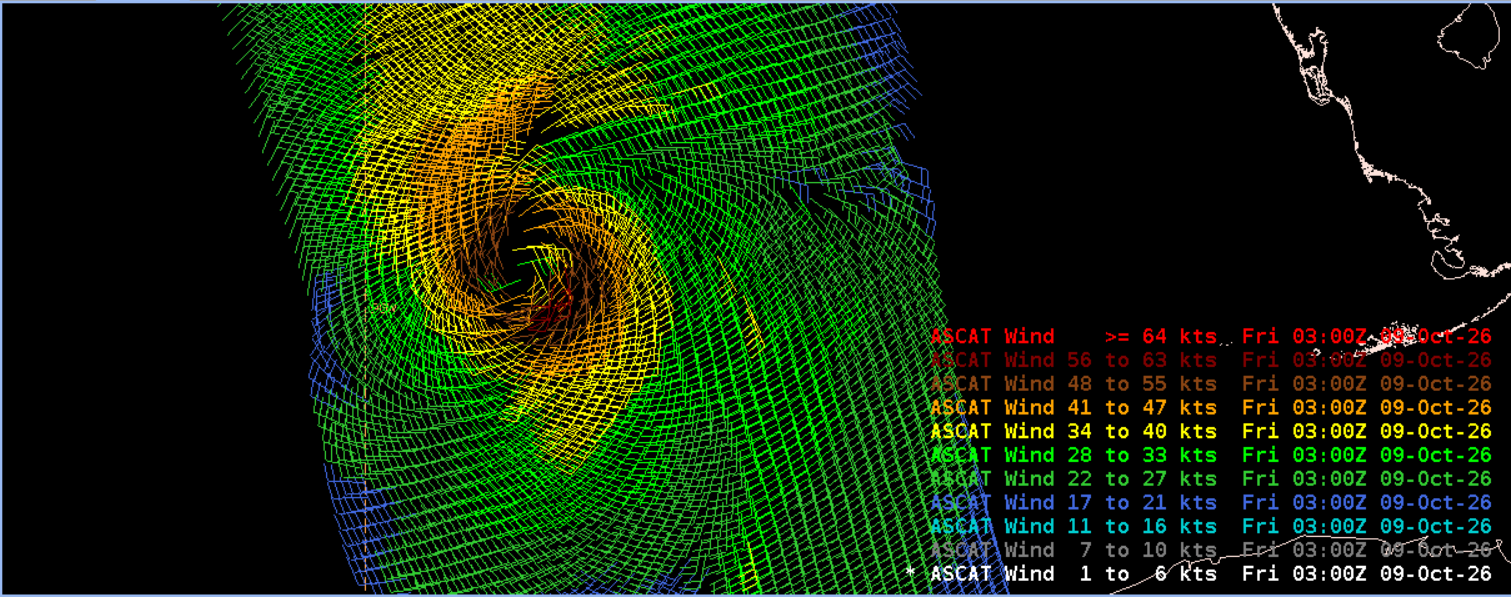
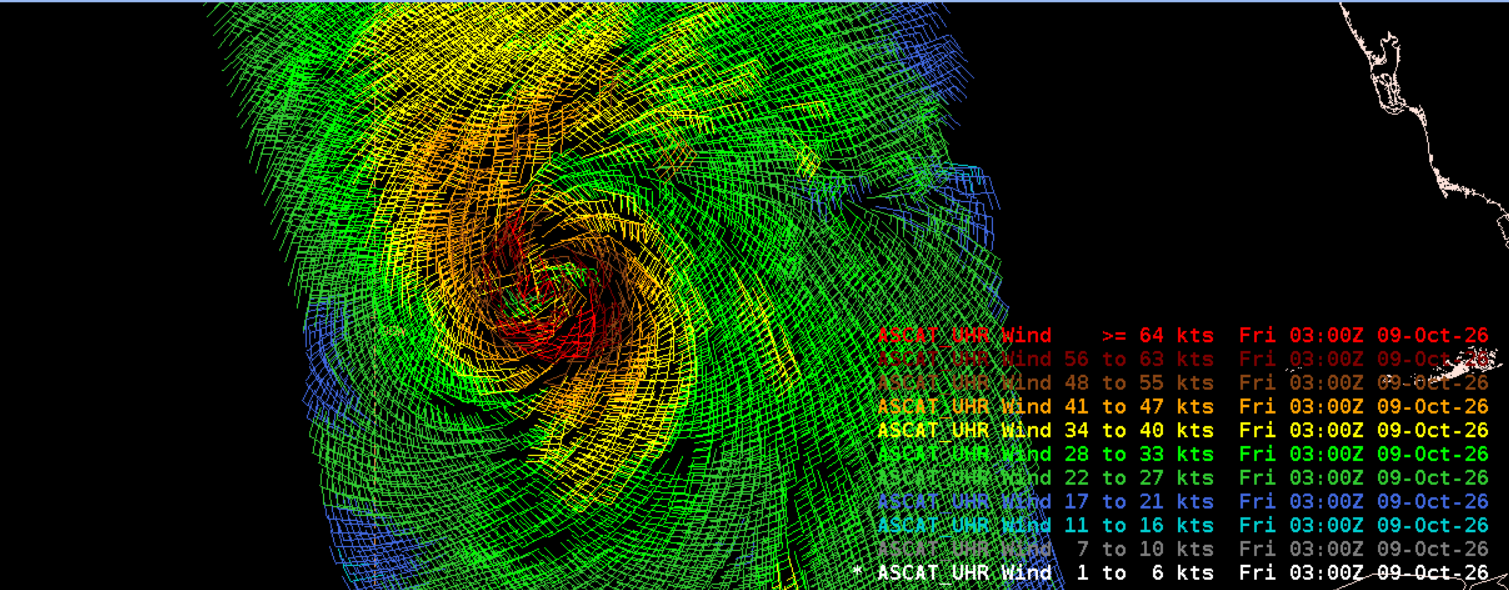
When Isaias was a Category 2 Hurricane at 0300 UTC 09 October 2026, a Metop-B ASCAT pass observed winds around 60 knots. However, the Ultra High Resolution (UHR) ASCAT version identified winds in excess of hurricane-force (bright red barbs). These higher winds can be observed by the UHR ASCAT with its more granular, 4.45 km spatial resolution. UHR ASCAT Winds are not rain flagged, so wind observations that are extreme outliers in speed and direction should be treated with caution. This product is run for tropical cyclones and can be implemented in AWIPS.

Figure 4: Metop-B ASCAT Winds (left) and UHR ASCAT Winds (right) at ~0300 UTC 09 October 2026. These images were exported from AWIPS, and display files can be shared upon request.

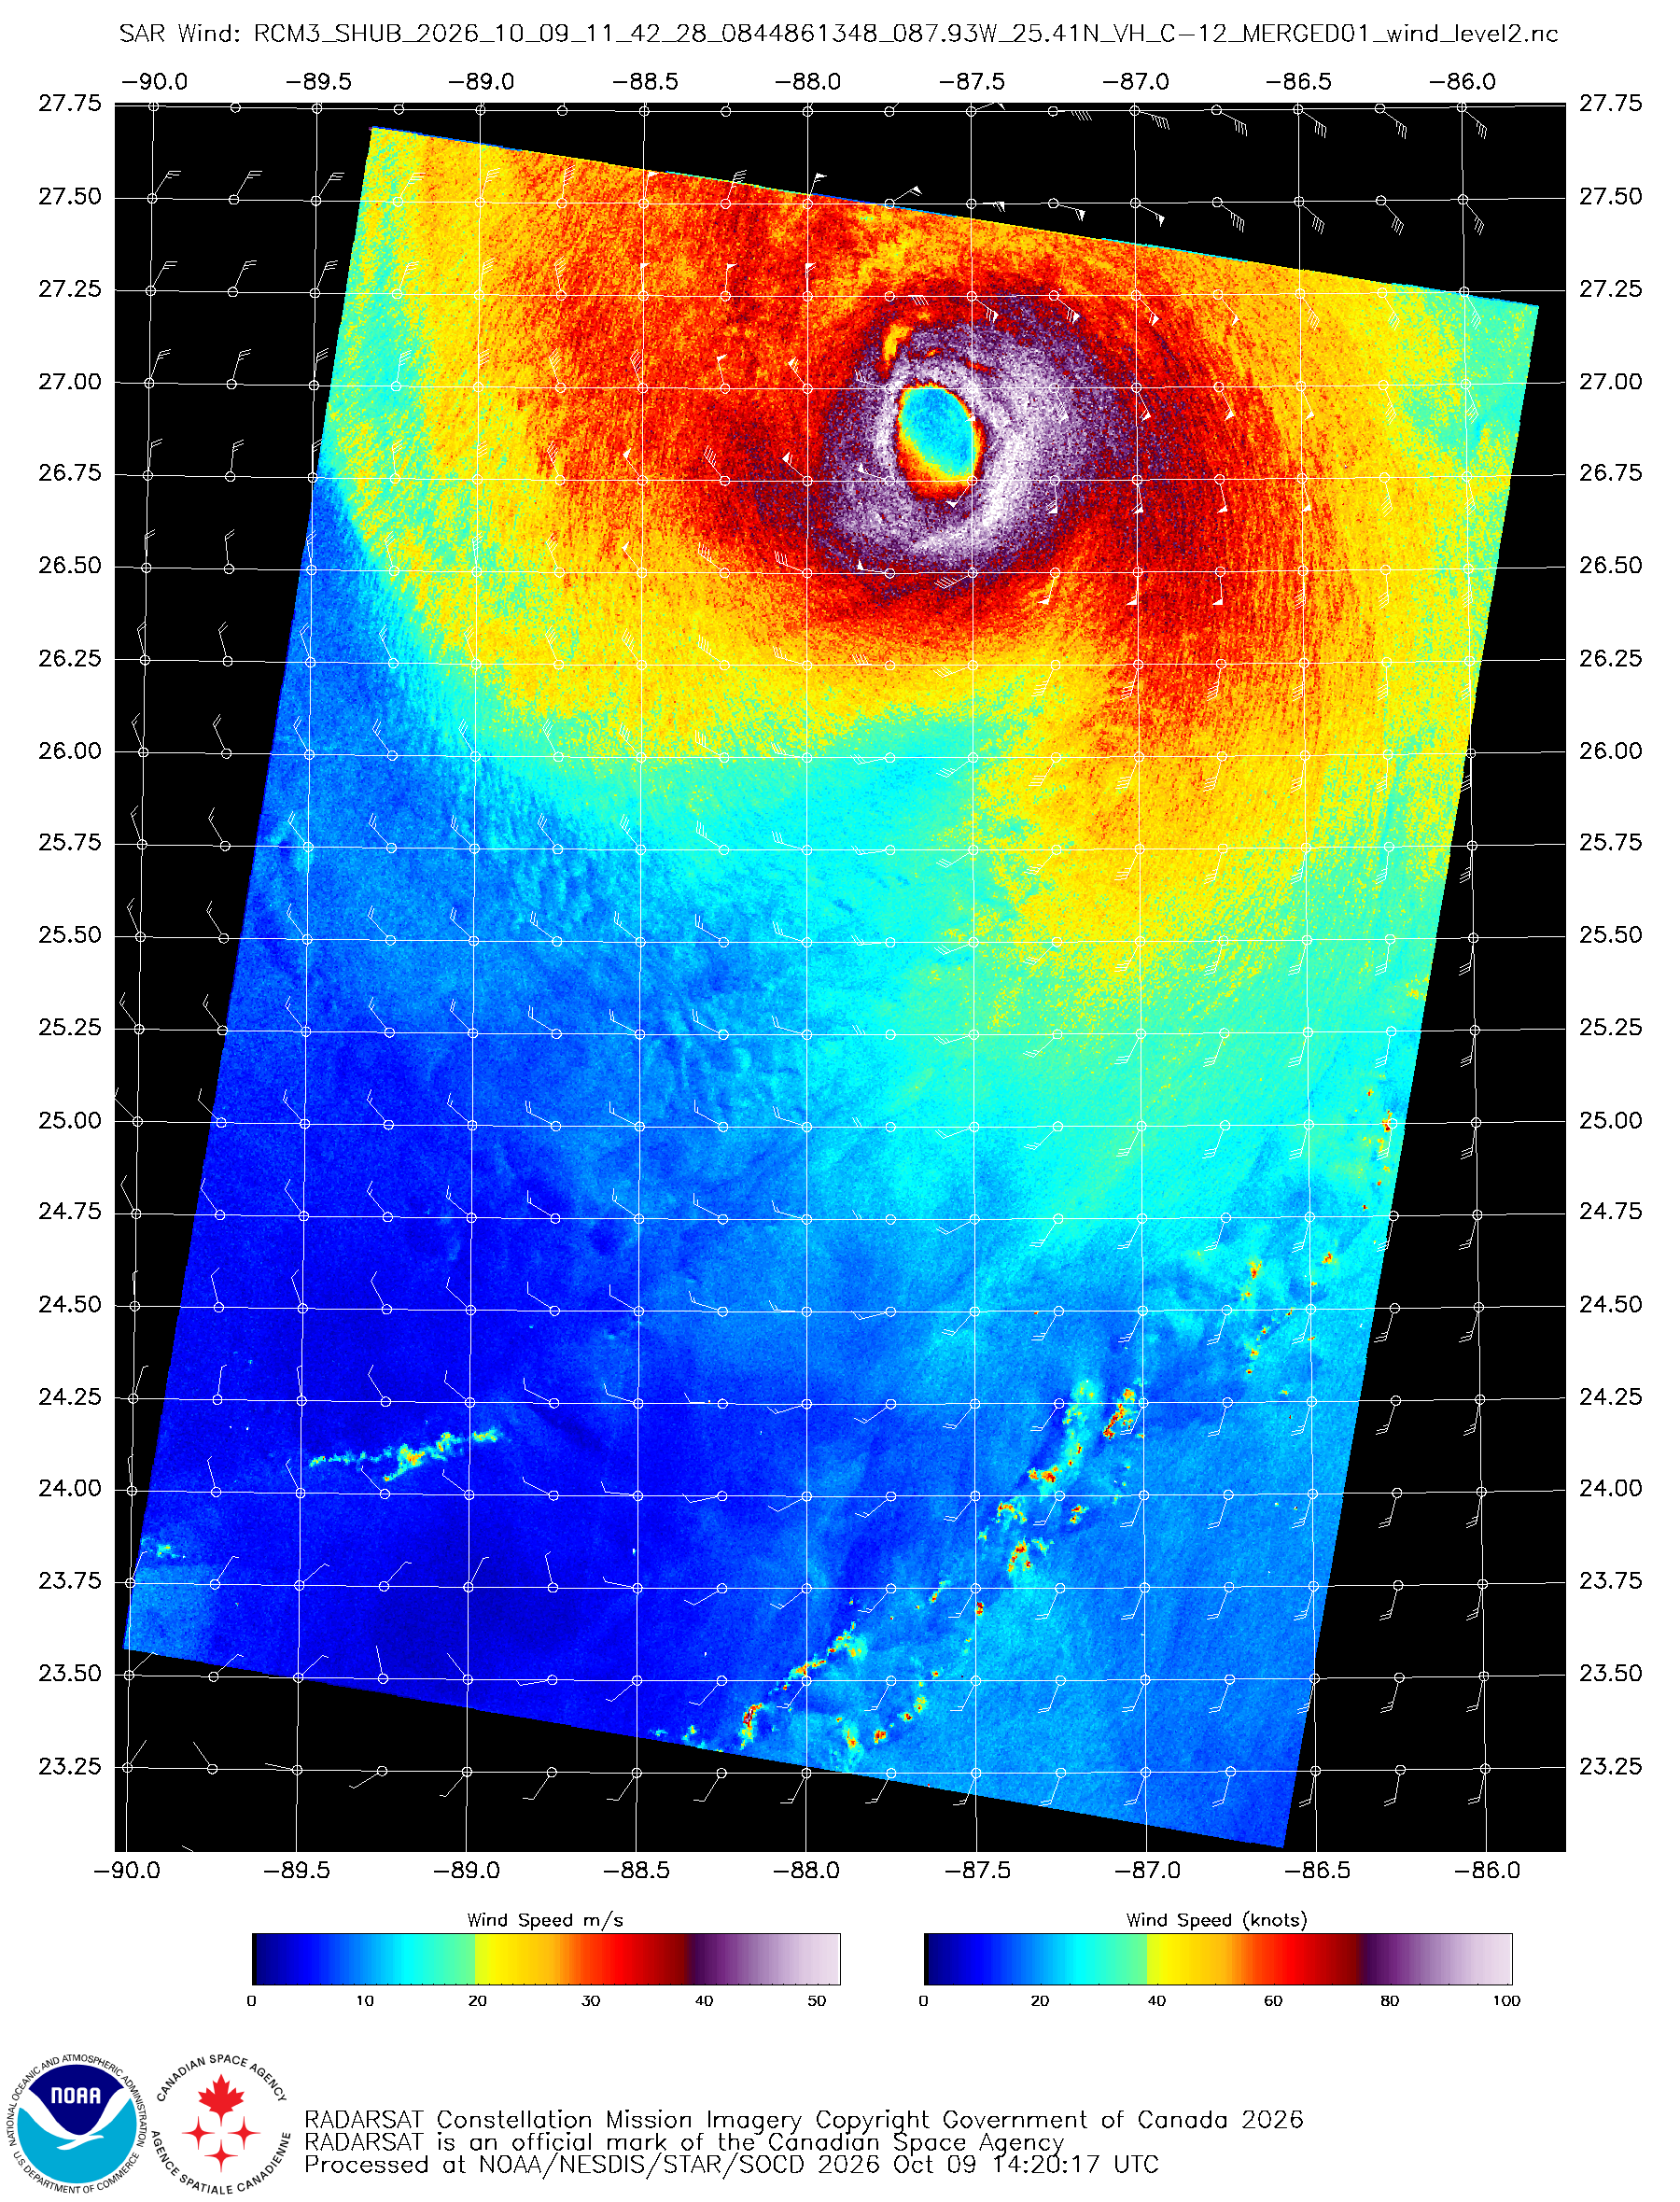
A Synthetic Aperture Radar (SAR) pass from the RADARSAT Constellation Mission-3 (RCM-3) satellite at ~1140 UTC 09 October 2026 captured Hurricane Isaias’ wind field at 500-m spatial resolution, observing wind speeds near 100 knots just as the system was poised to become a major hurricane.

Figure 5: RCM3 SAR Imagery valid at ~1140 UTC 09 October 2026. RADARSAT Constellation Mission Imagery Copyright Government of Canada 2026. RADARSAT is an official mark of the Canadian Space Agency. Credit: NESDIS/STAR

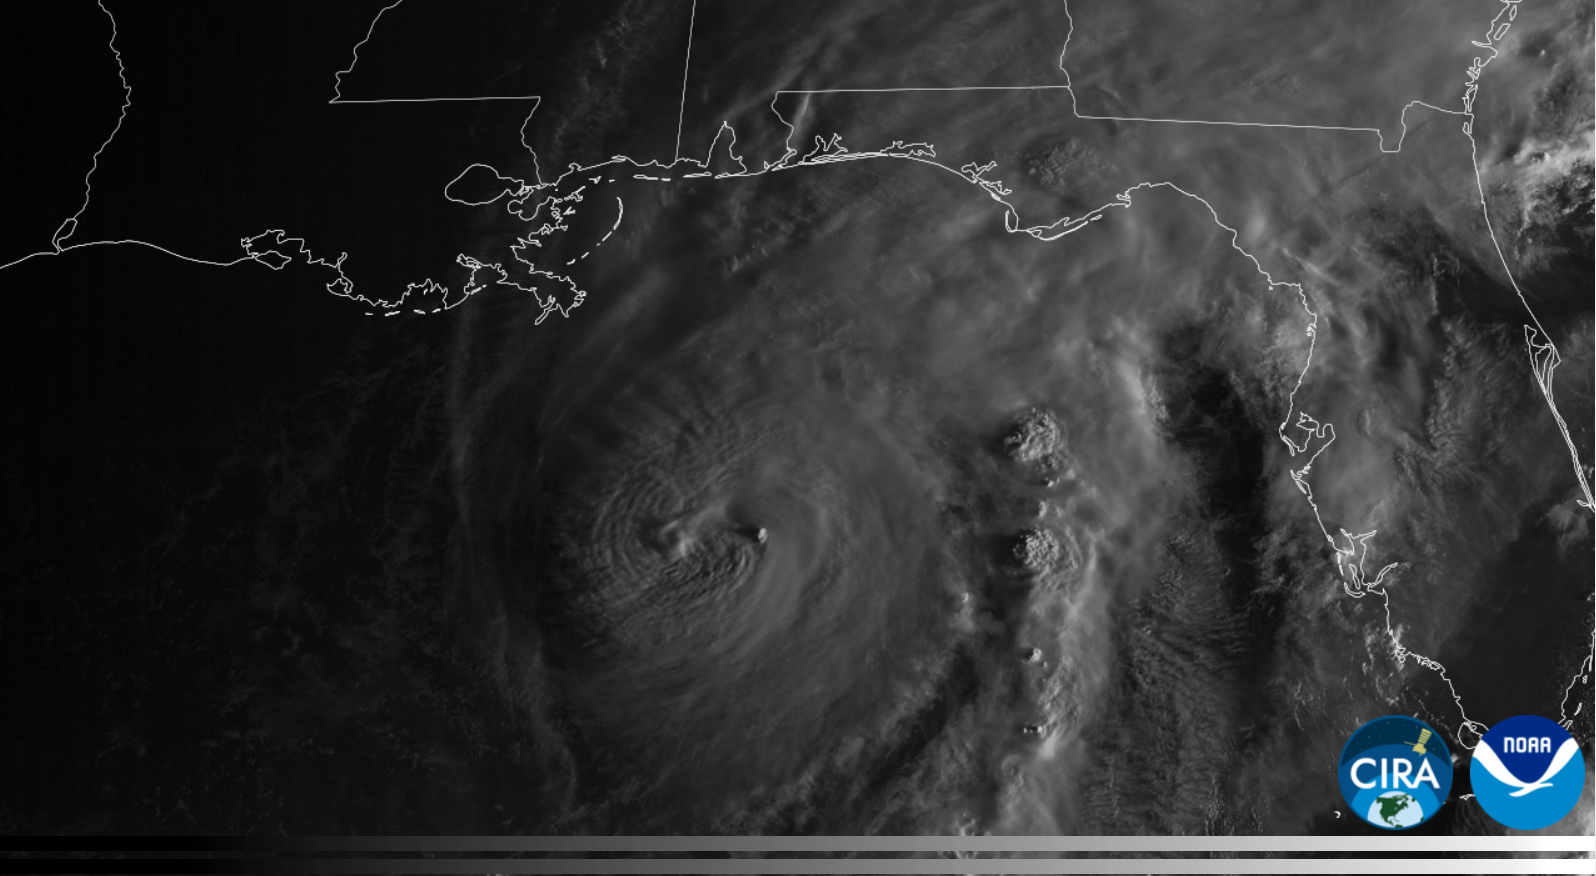
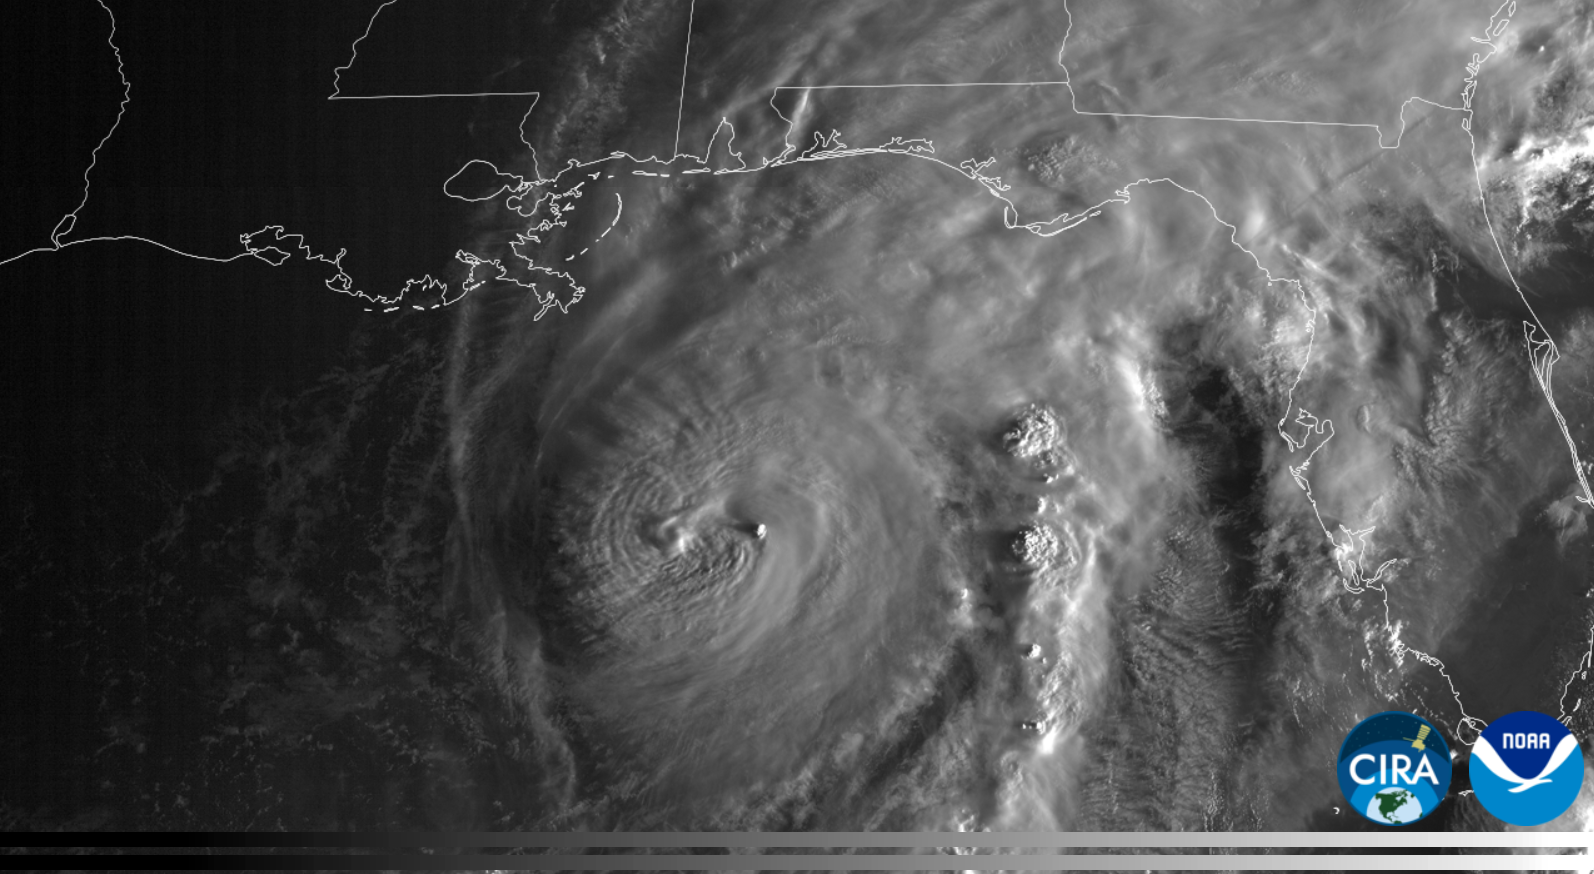
As the sun rose on 09 October 2026, GOES-East CONUS Solar Zenith Angle (SZA)-Adjusted Visible Band 02 imagery at ~1200 UTC provided a much clearer look at the cloud textures surrounding the circulation of Hurricane Isaias compared to the traditional visible imagery. This product aims to brighten imagery around sunrise/sunset. More information on the product’s evaluation can be found in the 2026 Satellite Proving Ground Hazardous Weather Testbed (HWT) Report, and the product will be made available to NWS WFOs in the TOWR-S v27 package.

Figure 6: GOES-East CONUS visible (left) and SZA-corrected visible (right) at ~1200 UTC 09 October. From CIRA Slider

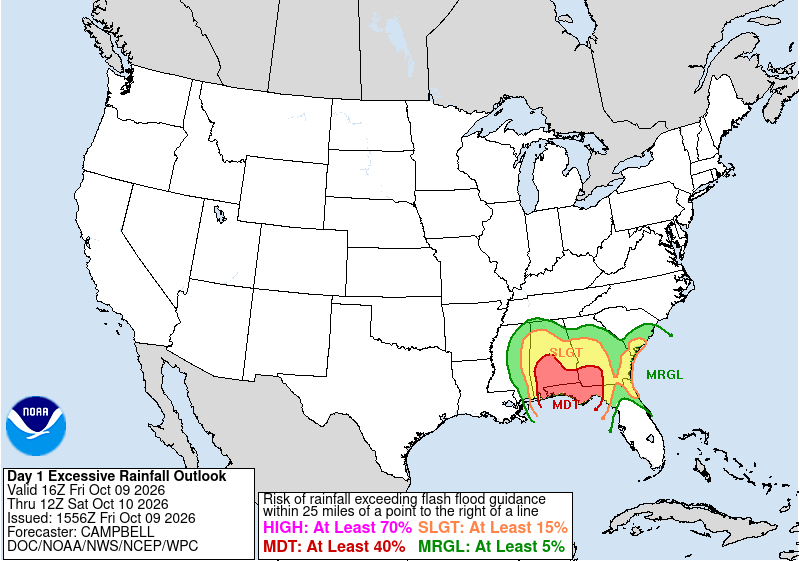
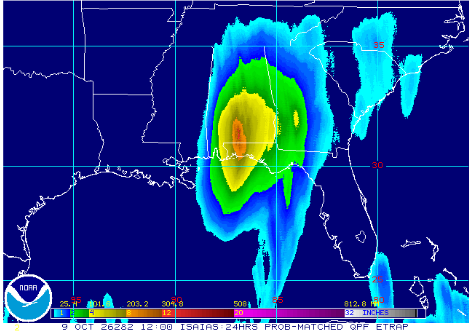
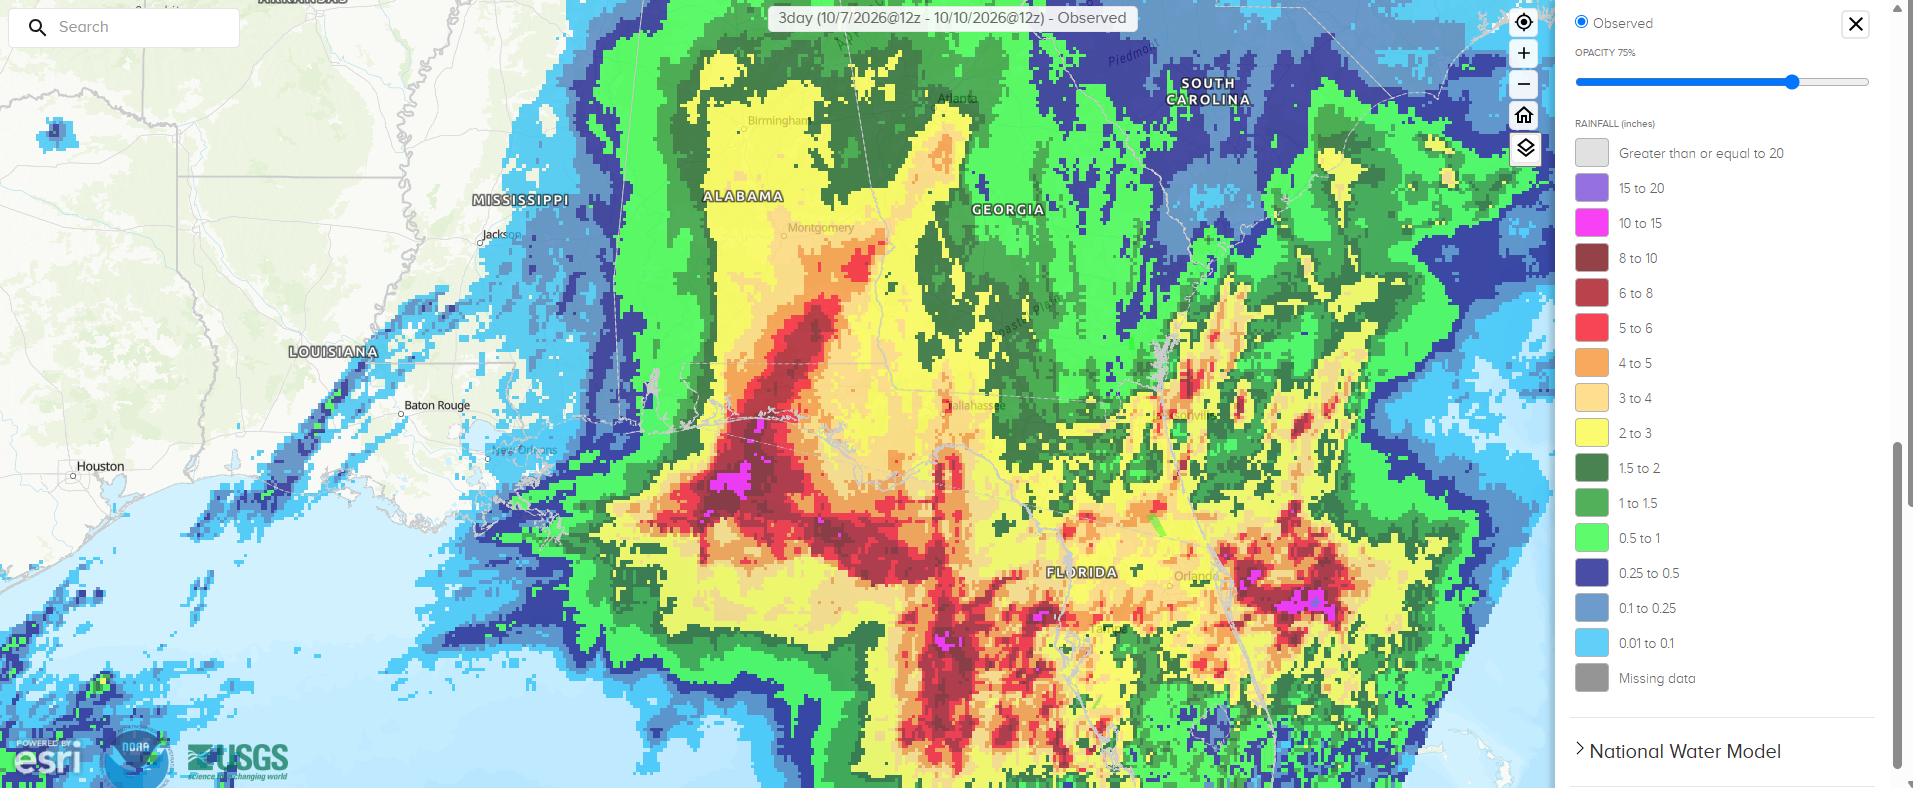
With Hurricane Isaias approaching landfall, the NWS Weather Prediction Center (WPC) was messaging the threat for heavy rainfall. In its Day 1 Excessive Rainfall Outlook (ERO), a large Moderate Risk was issued from the FL Panhandle into southern AL and southwestern GA. This elevated flash flood risk area aligned quite well with high precipitation amounts forecasted in the NESDIS Ensemble Tropical Rainfall Potential (eTRaP) Product. The eTRaP product combines forecasts using observations from microwave sounders and the tropical cyclone forecast track to predict rainfall going forward over the next 24 hours. For the 24-hour period leading up to 1200 UTC 10 October 2026, rainfall amounts of 8-12″+ were forecasted in a narrow strip from the western FL Panhandle into southern AL. The NWS National Water Prediction Service (NWPS) 24-hour Multi-Sensor Precipitation Analysis for 1200 UTC 10 October 2026 showed that the eTRaP verified quite well with heaviest rainfall totals, especially across the FL Panhandle.

NWS WPC ERO
Figure 7: NWS WPC ERO issued at 1556 UTC 09 October, valid for the 24-hour period ending at 1200 UTC 10 October 2026.
1200 UTC 09 October eTRaP output
Figure 8: 1200 UTC 09 October eTRaP output for the 24-hour period ending at 1200 UTC 10 October 2026. Credit: NESDIS/OSPO
NWS NWPS 24-Hour Precipitation Estimation
Figure 9: NWS NWPS 24-Hour Precipitation Estimation output valid at 1200 UTC 10 October 2026.

Isaias made landfall as a Category 2 Hurricane at 0130 UTC 10 October 2026 with maximum sustained winds of 105 mph. The system then underwent a fast extratropical transition, becoming post-tropical by 0600 UTC. GOES-East CONUS Air Mass RGB imagery captured the system’s transformation, from having a well-defined eye and symmetric shape leading up to landfall, to having well-defined fronts by the time it pushed through much of AL. You’ll also notice that the dark green colors representing moist tropical air are replaced by oranges and reds representing much drier air and stratospheric intrusions of potential vorticity.

Figure 10: GOES-East CONUS Air Mass RGB imagery from 1201 UTC 09 October – 1156 UTC 10 October 2026. Credit: NESDIS/STAR

As the post-tropical cyclone pushed inland, Isaias’ remnants delivered heavy rainfall and tornadoes to much of the Eastern U.S. GOES-East CONUS IR imagery captured the evolution of the system and rounds of convection that pushed northeastwards.

Figure 11: GOES-East CONUS IR imagery from 1931 UTC 09 October – 1911 UTC 11 October 2026. Credit: NESDIS/STAR

Picture of Christopher Smith

Christopher Smith

Christopher Smith joined ESSIC/CISESS, University of Maryland in 2023 and is the GOES-R Satellite Liaison to the NWS Weather Prediction Center and Ocean and Tsunami Center. Smith works to interpret experimental satellite imagery and products, and make such products available to forecasters and the NWS for a route to operations. He trains forecasters how to use satellite imagery in weather forecasting, while also delivering forecaster feedback to satellite developers to maximize meteorological satellite capabilities. Smith is an alumni of the UMD Atmospheric & Oceanic Science (AOSC) Department, and his long-term interests include infusing AI-Satellite Products to increase lead time in decision making for forecasters.