Home » Precipitation » Page 4

Tag: Precipitation

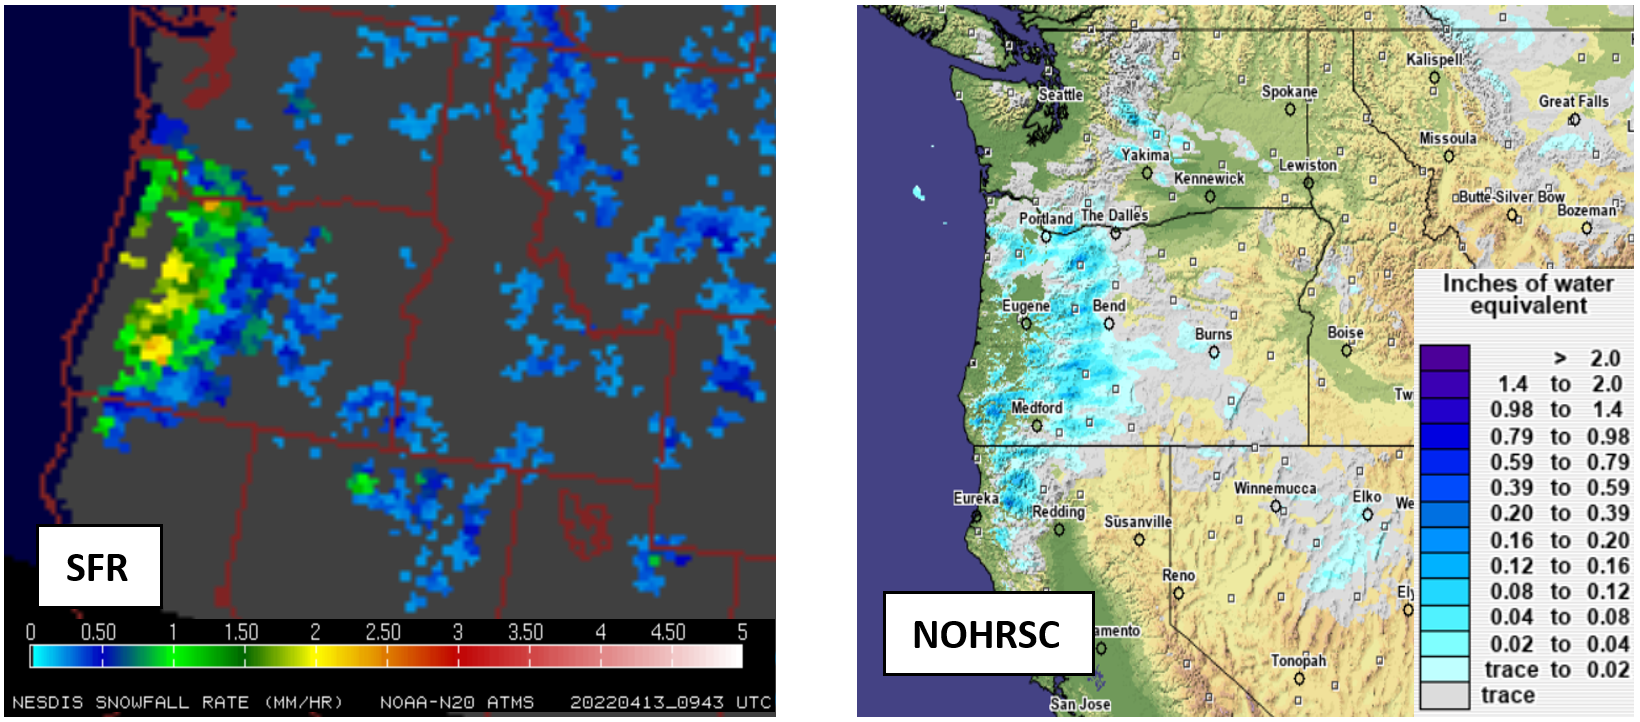
Figures 1 and 2: Snowfall rate from Pacific Northwest snowstorm on April 13, 2022, (left) NOAA-20 SFR, (right) NOHRSC

Microwave Snowfall Rate Product Captures Late Season Pacific Northwest Snowfall

The STAR scientist team of Huan Meng, Yongzhen Fan, Jun Dong, and Yalei You examined the performance of snowfall estimates from the passive microwave snowfall rate (SFR) product for the late season snowstorm that hit Washington and Oregon on April 13. The storm set the local record for most snow accumulation this late in the season, causing power outages and road closures across Portland, Oregon.

Read More »
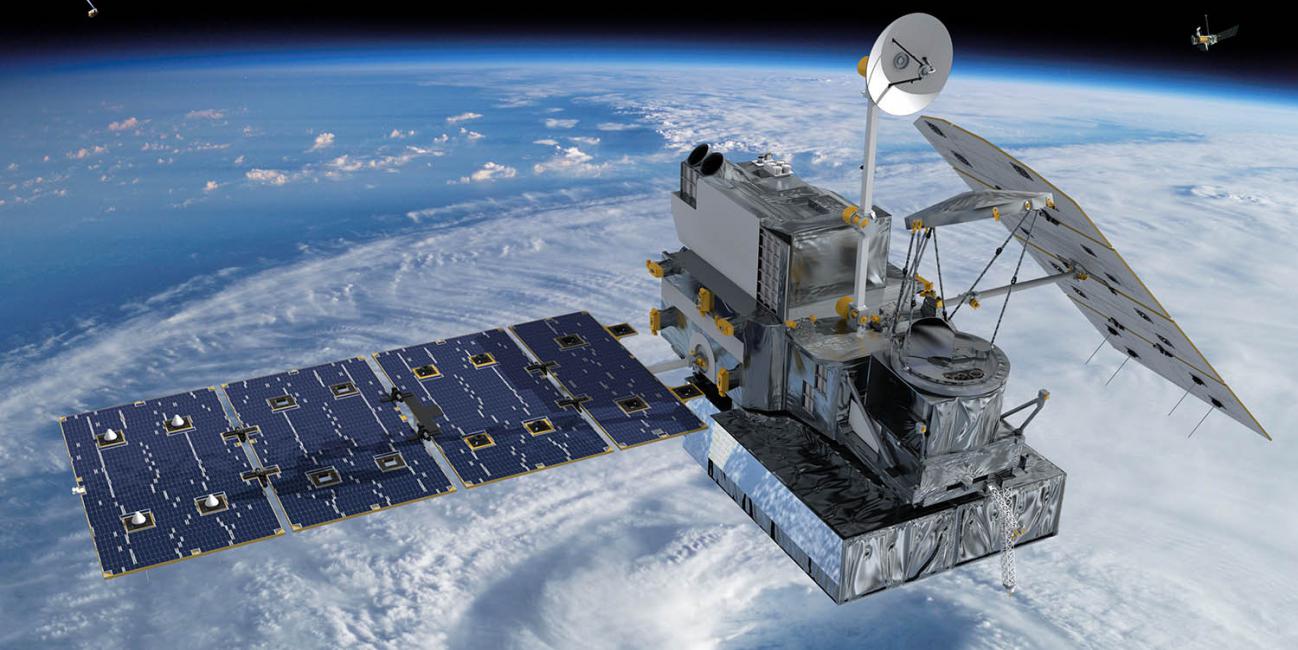
The The Global Precipitation Measurement Mission (GPM) satellite in Earth's orbit

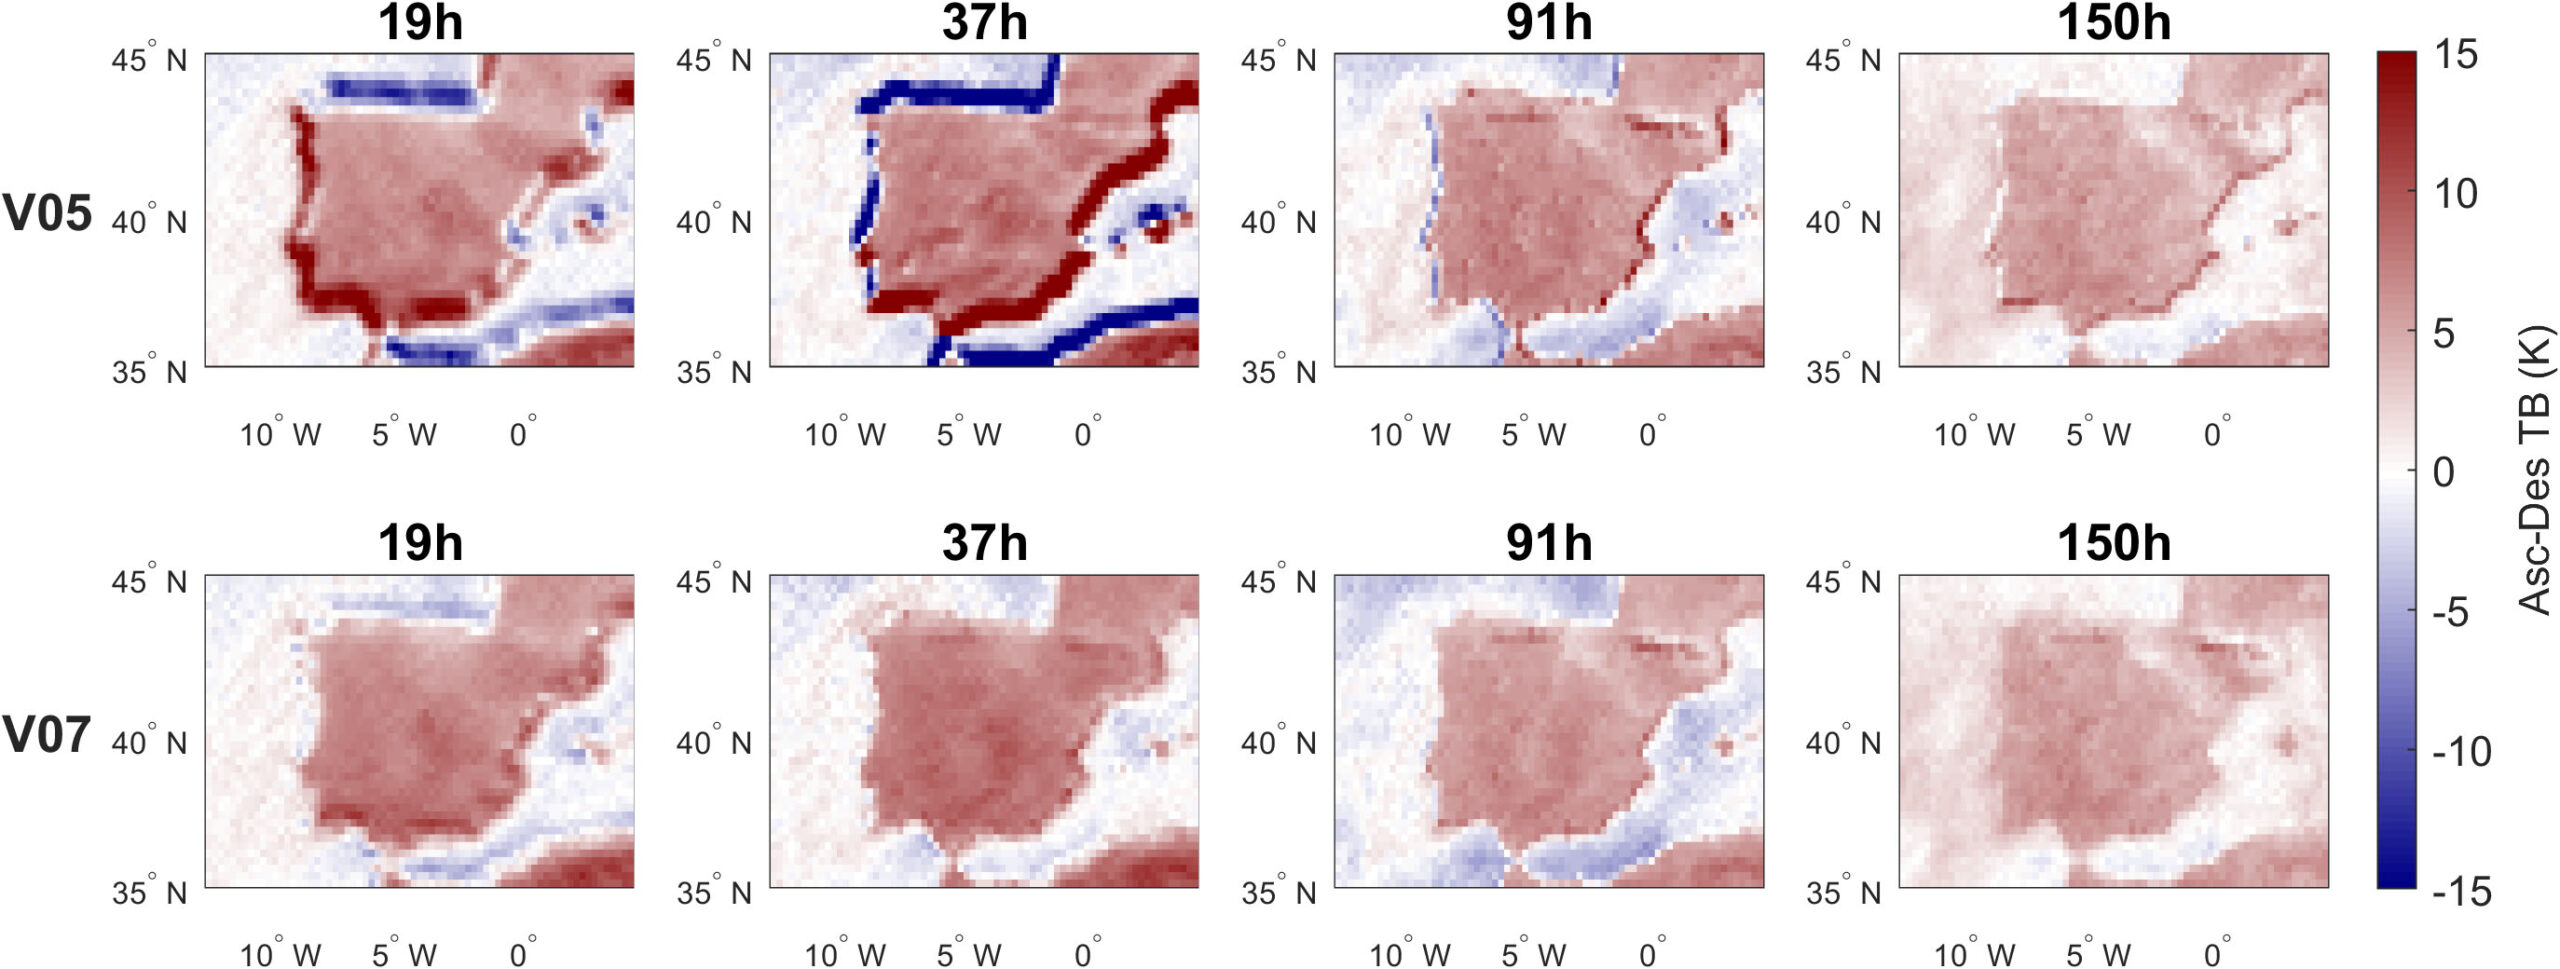
Insights From Coincidences of GPM and CloudSat Satellites

ESSIC/CISESS scientists Yalei You and Sarah Ringerud have a new paper out in IEEE Transactions on Geoscience and Remote Sensing along with University of Minnesota scientists Sajad Vahedizade and Ardeshir Ebtehaj and F. Joseph Turk from Jet Propulsion Laboratory. The paper is titled “Passive Microwave Signatures and Retrieval of High-Latitude Snowfall Over Open Oceans and Sea Ice: Insights From Coincidences of GPM and CloudSat Satellites”. You leads a CISESS task on developing and assessing the NOAA Alaska Regional Snowfall Rate Product.

Read More »
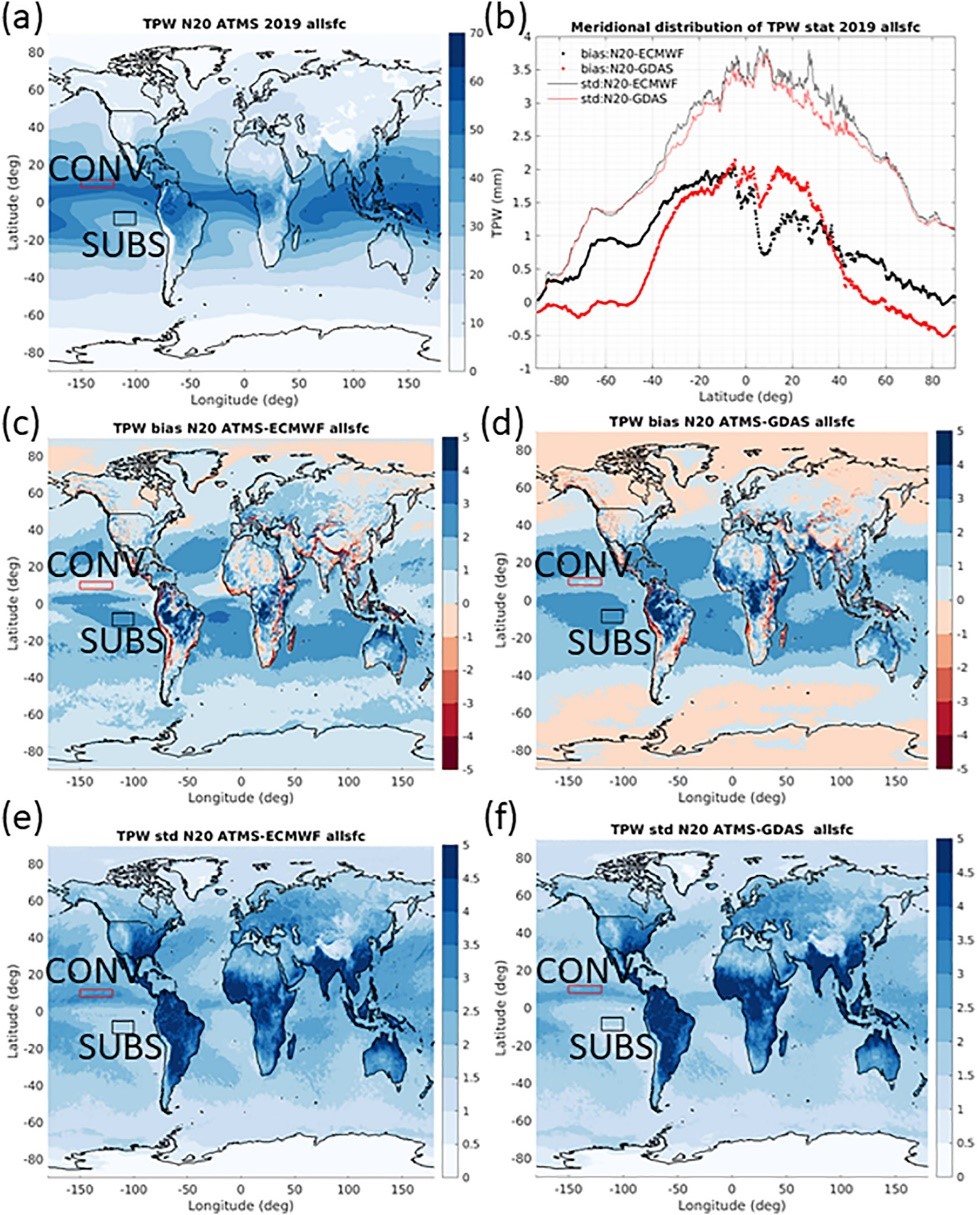
Figure 1. (a) Horizontal distribution of MiRS NOAA-20 ATMS TPW for all of 2019, (b) meridional distribution of statistics for MiRS NOAA-20 ATMS TPW versus ECMWF (black) and GDAS (red) (dots are bias (mm) and lines are standard deviation (mm)): number of pixels are more than 1.2 million for each latitude between 80°S and 80°N. Beyond this area the number of pixels decreases significantly. Global distribution of bias (mm) of (c) MiRS NOAA-20 ATMS TPW – ECMWF TPW, (d) MiRS NOAA-20 ATMS TPW – GDAS TPW, standard deviation (mm) of MiRS NOAA-20 ATMS TPW versus (e) ECMWF TPW and (f) GDAS TPW. All results are for combined ascending and descending orbits in 2019. The red box (120°W ∼ 150°W & 8°N ∼ 12°N) in each plot indicates an area typically characterized by strong convection (CONV area) and the black box (100°W ∼ 120°W & 5°S ∼ 12°S) indicates an area typically dominated by subsidence (SUBS area).

In-Depth Evaluation of MiRS Total Precipitable Water From NOAA-20 ATMS

The MiRS Science Team, composed of ESSIC/CISESS scientists Yong-Keun Lee and Christopher Grassotti, as well as NOAA STAR scientist Mark Liu, published a paper this week titled “In‐Depth Evaluation of MiRS Total Precipitable Water From NOAA‐20 ATMS Using Multiple Reference Data Sets” in Earth and Space Science. Lee was the first author of the study.

Read More »
AMS Annual Meeting 2022 logo

ESSIC/CISESS at AMS Conferences

The American Meteorological Society (AMS) Annual Meeting was held virtually this year from January 23 to 27. Simultaneously, AMS held a number of specialized conferences and symposiums, focusing on topics including hydrology, climate variability and change, and atmospheric chemistry. ESSIC/CISESS scientists contributed a large number of talks and posters at the event. Talks included:

Read More »
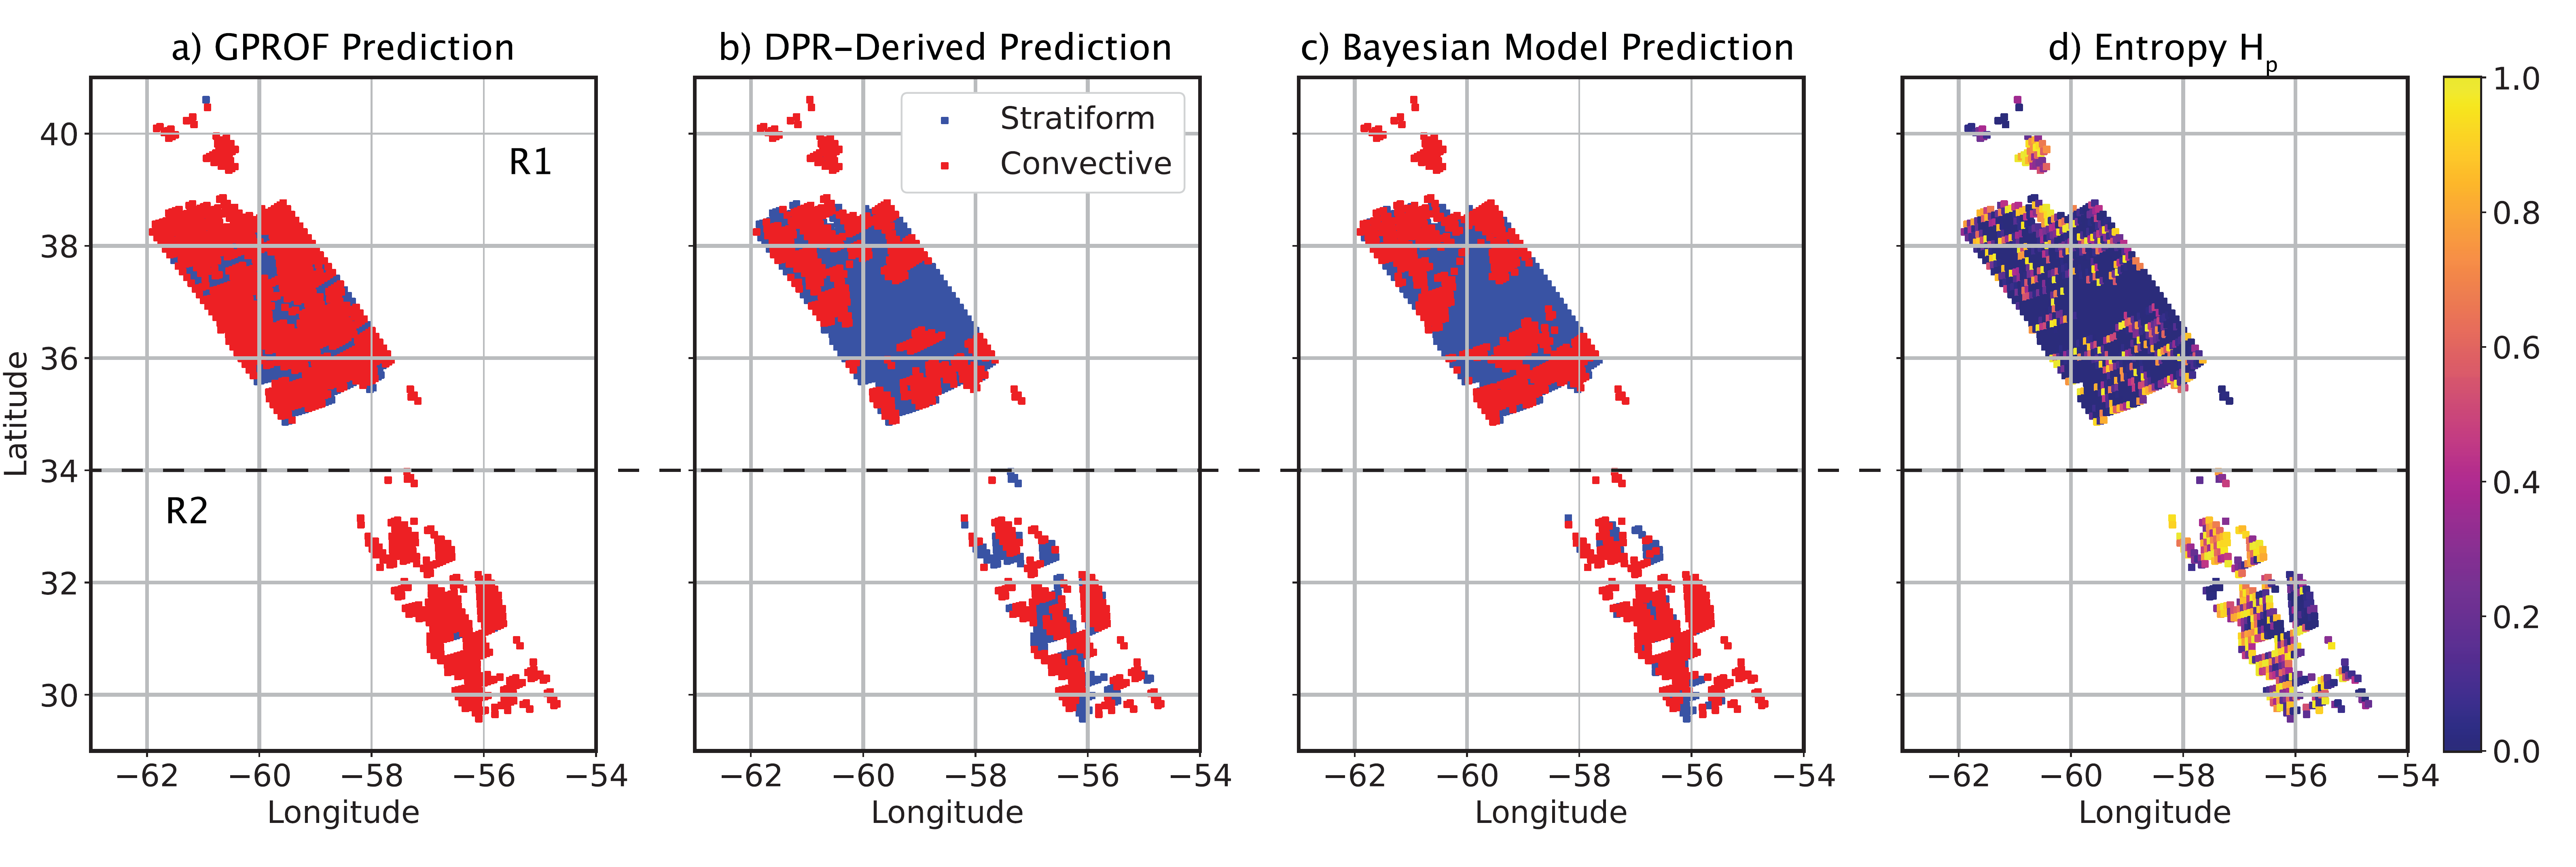
Figure: Case study of August 11, 2018. Convective/stratiform split of the raining system observed by GPM-core satellite (orbit: 025293). From left to right: (a) PMW-retrieved (GPROF) – a current operational benchmark; (b) Dual-frequency Precipitation Radar-derived product – the truth; (c) Bayesian model prediction ResNetV2; (d) Entropy for the Bayesian model prediction – uncertainty map.

Using Bayesian Deep Learning to Improve Precipitation Retrievals

ESSIC/CISESS Scientist Veljko Petković co-authored a study on the application of new and emerging field of BDL concepts to mitigate problems associated with the accuracy of precipitation retrievals from satellite-borne passive microwave (PMW) radiometers, which was published in IEEE Geoscience and Remote Sensing Letters.

Read More »
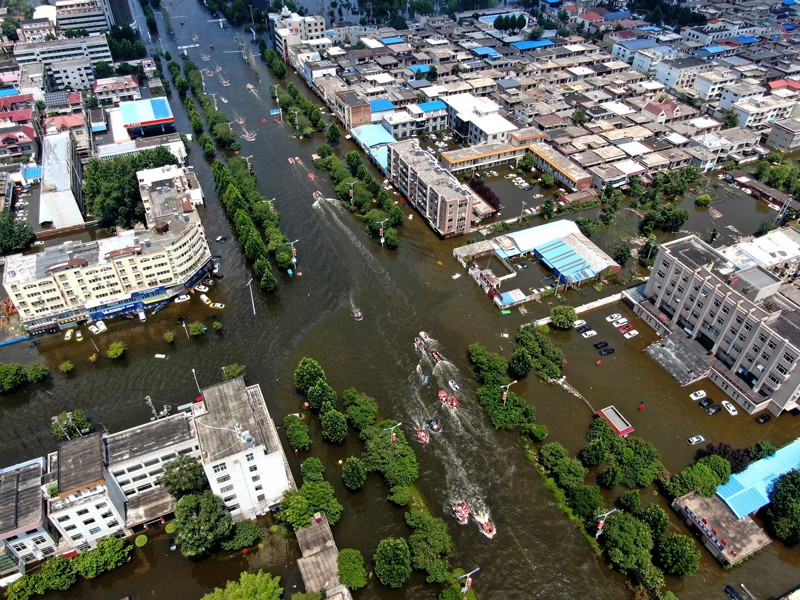
Figure 1 | Flooding in July 2021 caused mass evacuation in Weihui, Henan province, in China.

Extreme Rainfall Slows the Global Economy

Xin-Zhong Liang was recently published in Nature’s “News and Views” section giving his insight on new research that reported a comprehensive assessment of changes in gross regional product (GRP) relating to excessive precipitation. The study concluded that increases in the numbers of wet days and in extreme daily rainfall dramatically reduces worldwide macroeconomic growth rates.

Read More »
Snow falling around some pine trees

Snowfall Rate Product Captures First Nor’easter in 2022

The first nor’easter of 2022 swept through the Mid-Atlantic and the Northeast on January 2-4, 2022, resulting in a heavy snow accumulation of up to 14 inches in Virginia and southern Maryland and stranding hundreds of drivers on Interstate 95 in Virginia. The NOAA NESDIS Snowfall Rate (SFR) product captured the evolution of the snowstorm with retrievals from the Advanced Technology Microwave Sounder (ATMS) sensor aboard the S-NPP and NOAA-20 satellite missions, and the AMSU-A/MHS sensors aboard NOAA-19, Metop-B, and Metop-C.

Read More »
English: A top view scene of someone doing some research and going through the pages of a book and using a magnifying glass on it. The scene happens on a wooden background. There are also some other research related items in the scene, such as: sticky notes, pencil, ruler or notebook

CISESS Seed Grant Awards Announced

CISESS has announced four Seed Grant Program awards to help develop transformative research that requires a proof of concept to assist NOAA in recognizing and supporting new topics that eventually will be carried out in CISESS.

Read More »