University of Maryland

Atlantic Awakens with Extratropical Cyclone Activity

UMD/ESSIC/CISESS GOES-R Satellite Liaison for NWS WPC

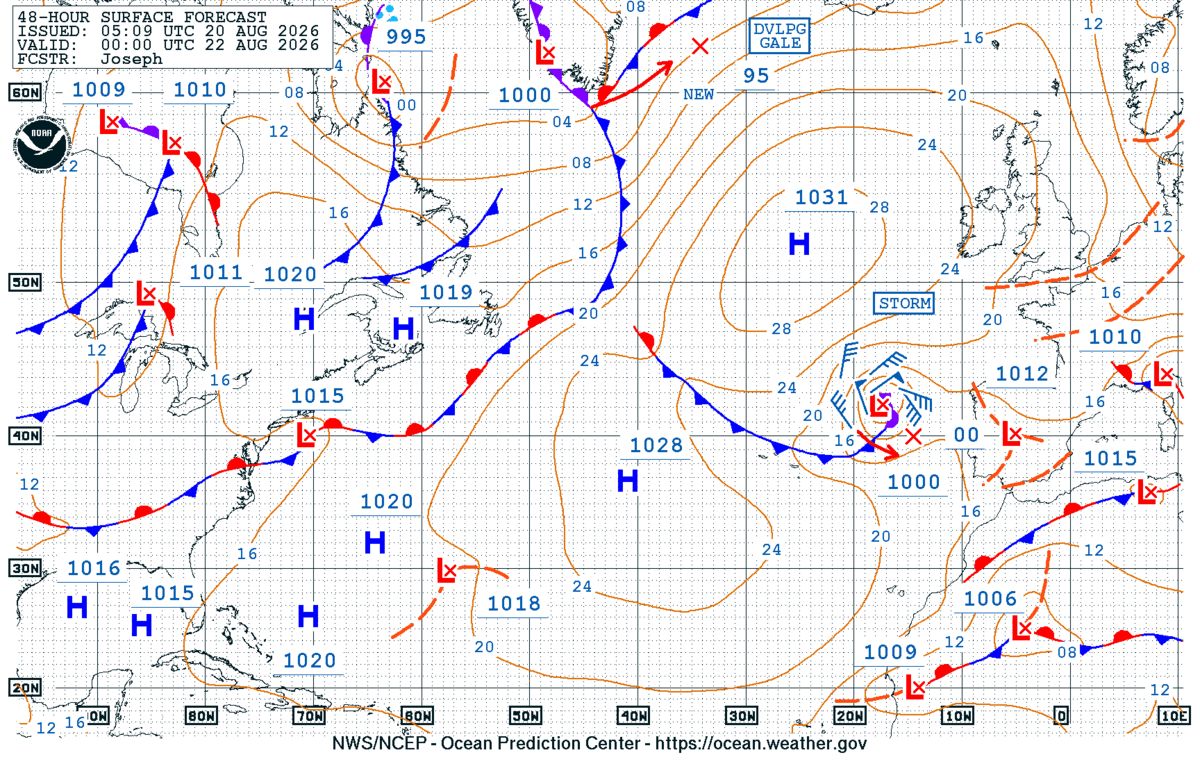
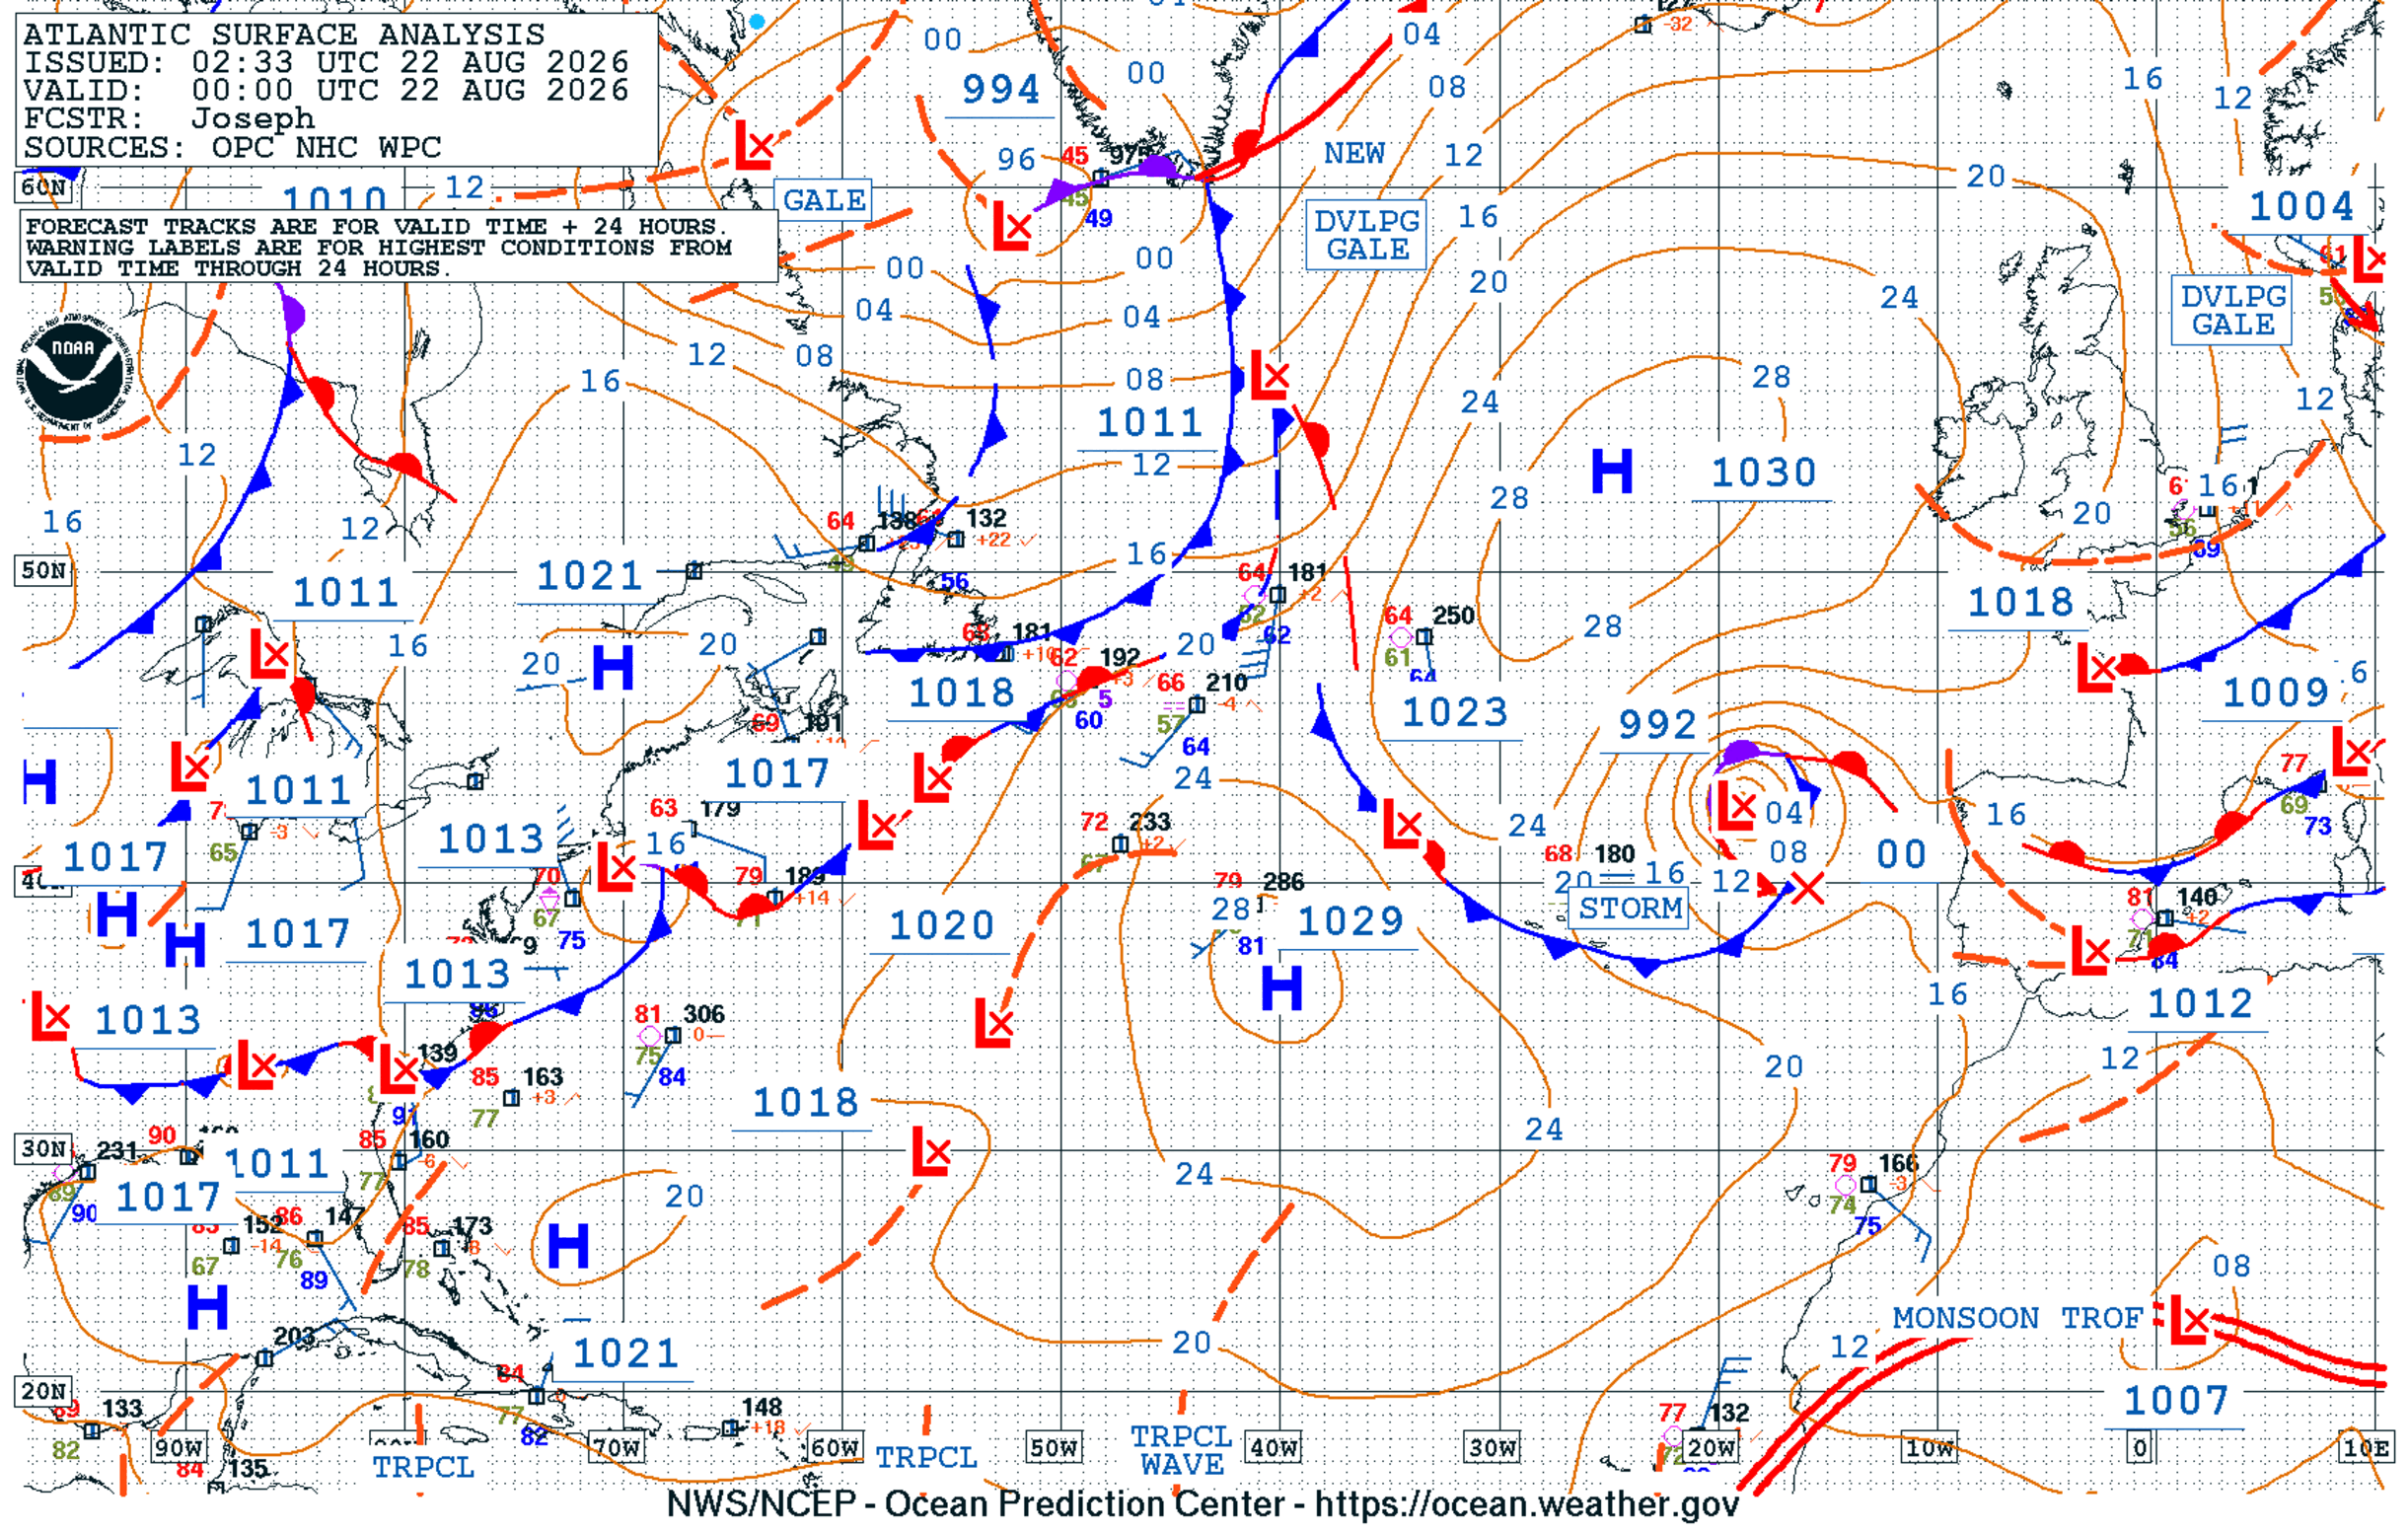
After a typical Summer lull in extratropical cyclone activity across the Atlantic waters, signs of Fall arose last week as a storm-force low developed. The NWS Ocean and Tsunami Center (OTC)’s North Atlantic 48-Hour Surface Forecast indicated a storm-force low just west of Portugal at 0000 UTC 22 August 2026. The forecast verified, with the NWS OTC analyzing a 992 hPa storm-force low in its North Atlantic Surface Analysis at this time.

 
Figure 1: NWS OTC North Atlantic 48-Hour Surface Forecast issued at 0509 UTC 20 August (left), and the North Atlantic Surface Analysis at 0000 UTC 22 August 2026 (right).

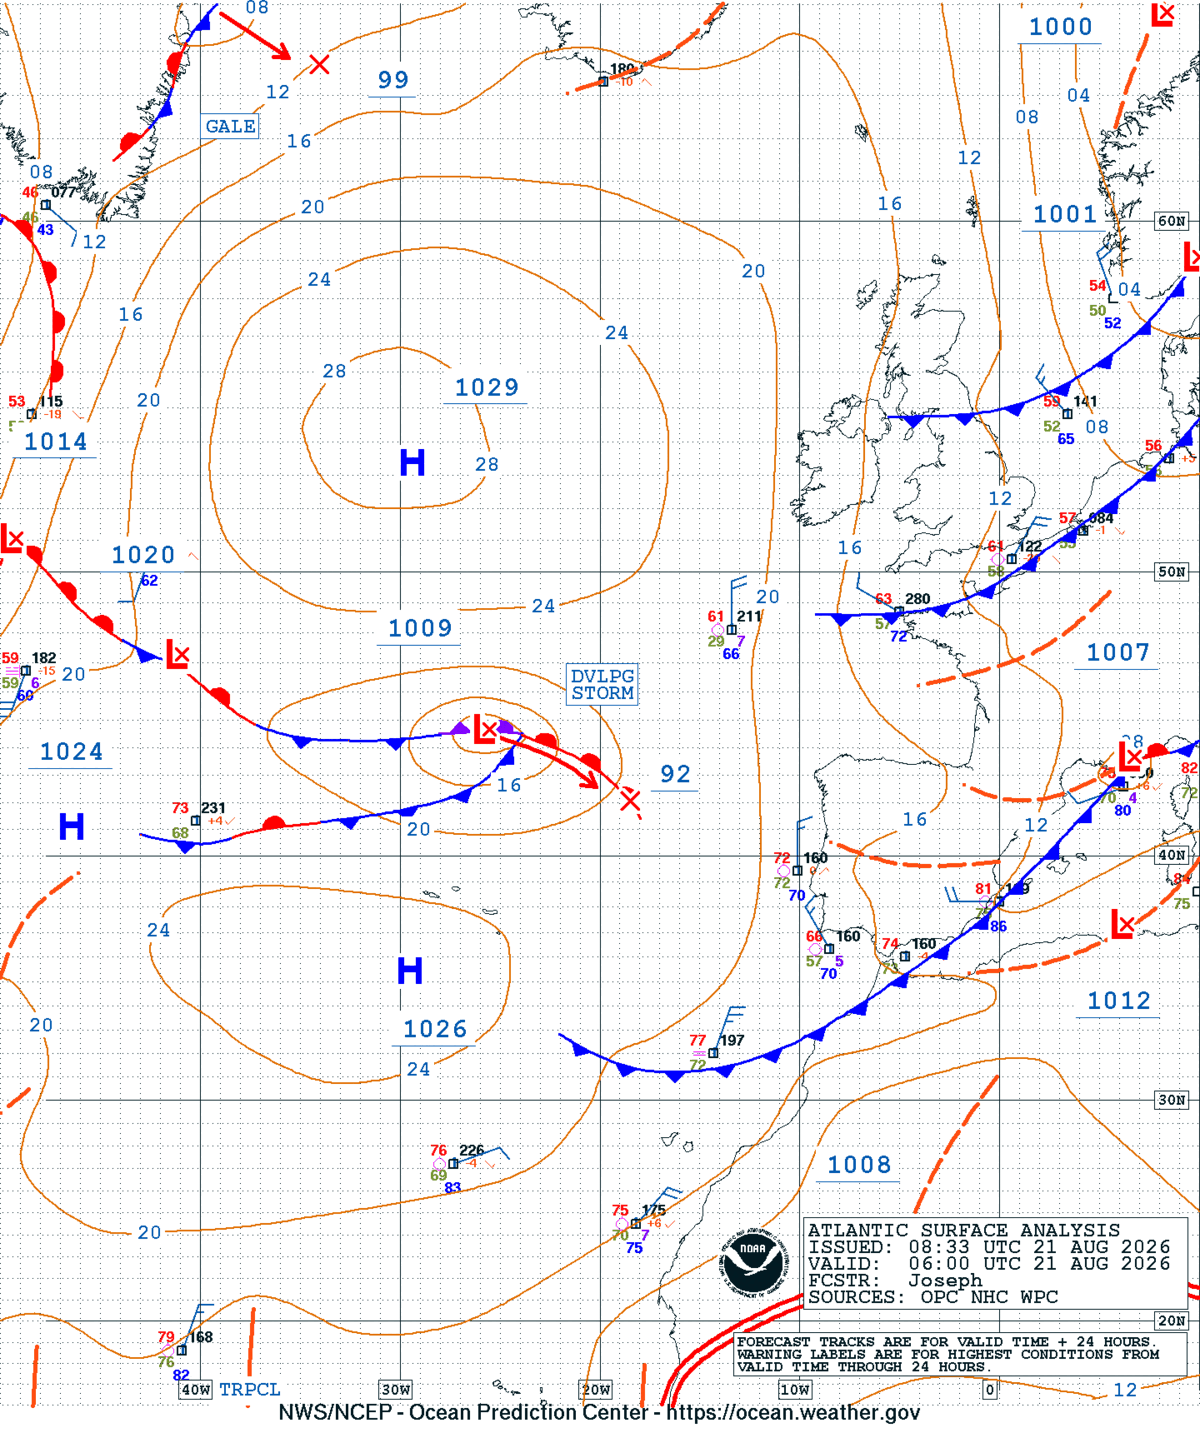
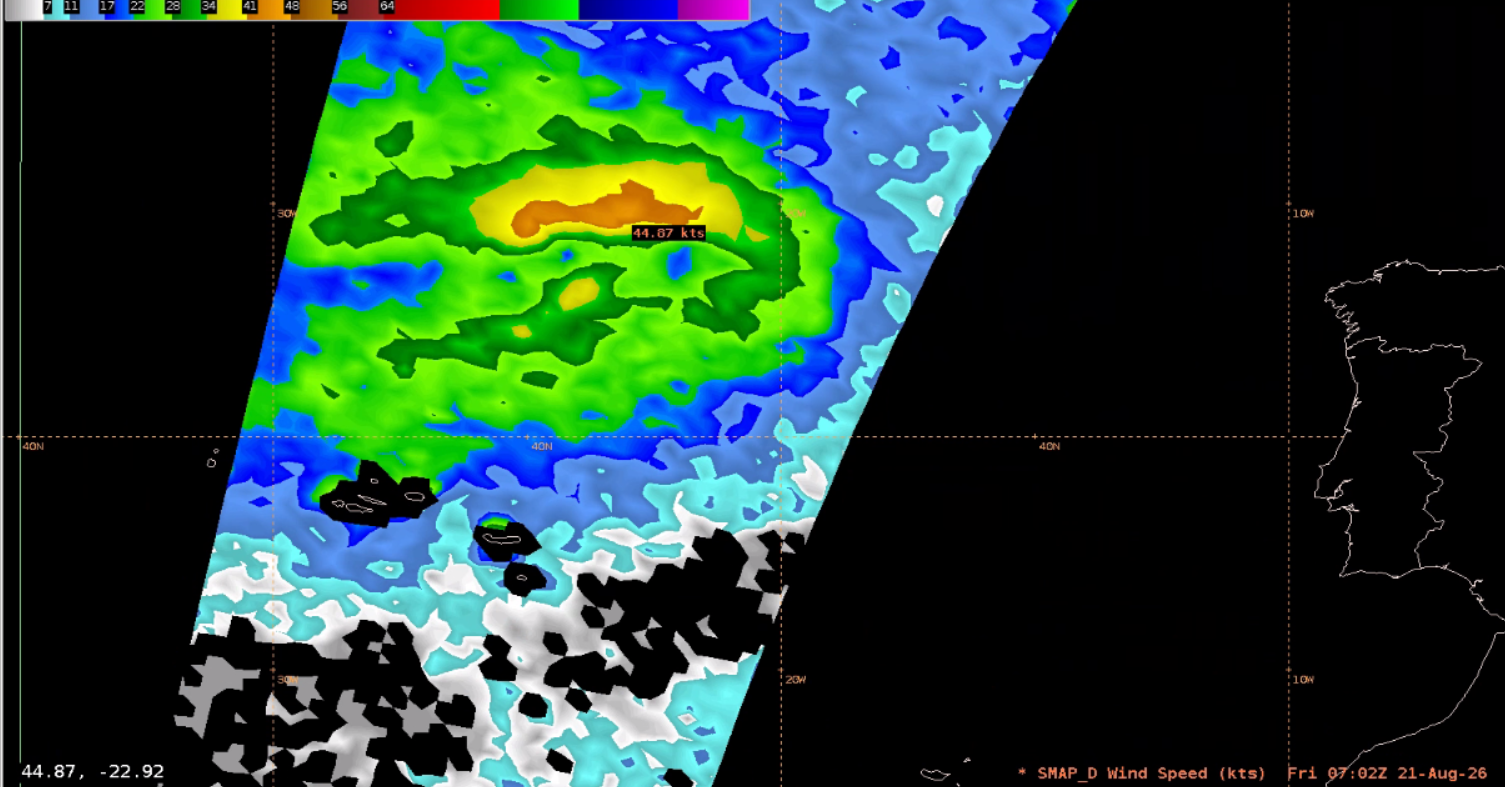
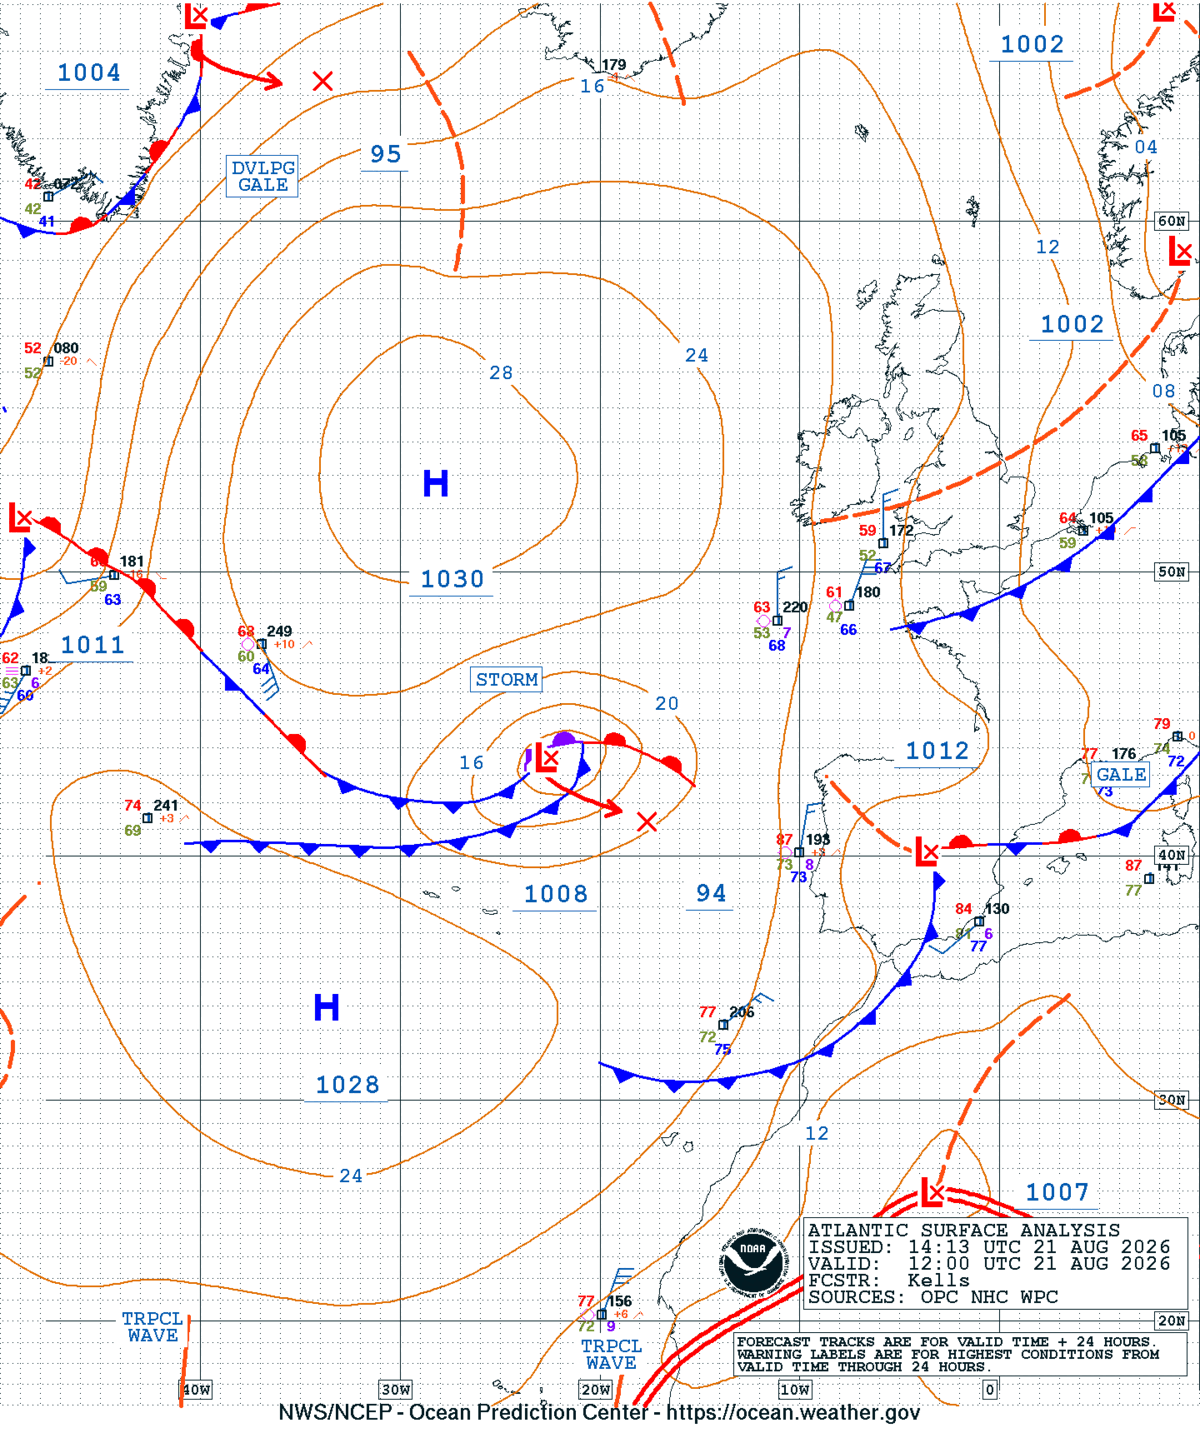
Prior to becoming storm-force, the NWS OTC analyzed the strengthening gale-force low as a ‘DVLP STORM’ on its 0600 UTC 21 August 2026 East Atlantic Surface Analysis. Shortly after this analysis at ~0700 UTC, derived winds from the L-band radiometer aboard NASA’s SMAP satellite measured speeds near 45 knots. SMAP Wind Speeds have a coarse, 60 km spatial resolution, but are less sensitive to rain contamination due to the presence of the longer L-band in comparison to C- and Ku-band scatterometers. SMAP Wind Speeds were recently made available to be implemented in AWIPS workstations, but do possess a longer 6-hour latency.

Figure 2: NWS OTC East Atlantic Surface Analysis valid at 0600 UTC 21 August 2026.
Figure 3: SMAP Wind Speeds output at ~0700 UTC 21 August 2026, with wind speeds approaching 45 knots. This image was exported from AWIPS, and display files can be shared upon request.

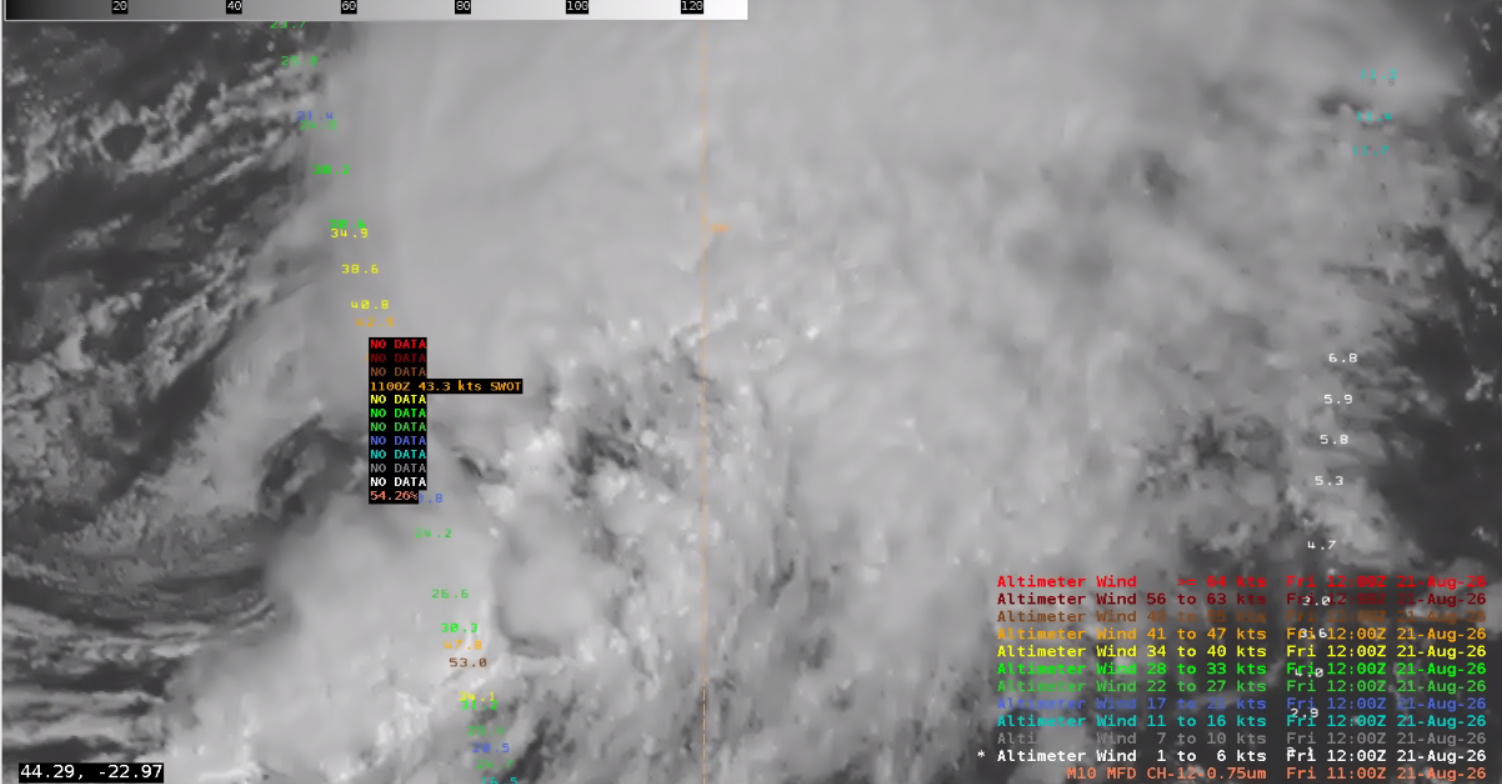
A few hours later, a SWOT altimeter pass, overlaid on Meteosat-10 visible imagery, confirmed wind speeds near 45 knots in the system’s northwest quadrant. In the SMAP output, the strongest winds were north and east of the low pressure circulation, so the 45 kt winds in the northwestern quadrant likely indicated continued strengthening. Meteosat-10 will move into backup in 2027 as Meteosat-12 (Meteosat Third Generation) is now the operational satellite and configurations can be implemented in AWIPS.

Figure 4: SWOT Altimeter Winds overlaid on Meteosat-10 visible imagery at ~1100 UTC 21 August 2026. This image was exported from AWIPS, and display files can be shared upon request.

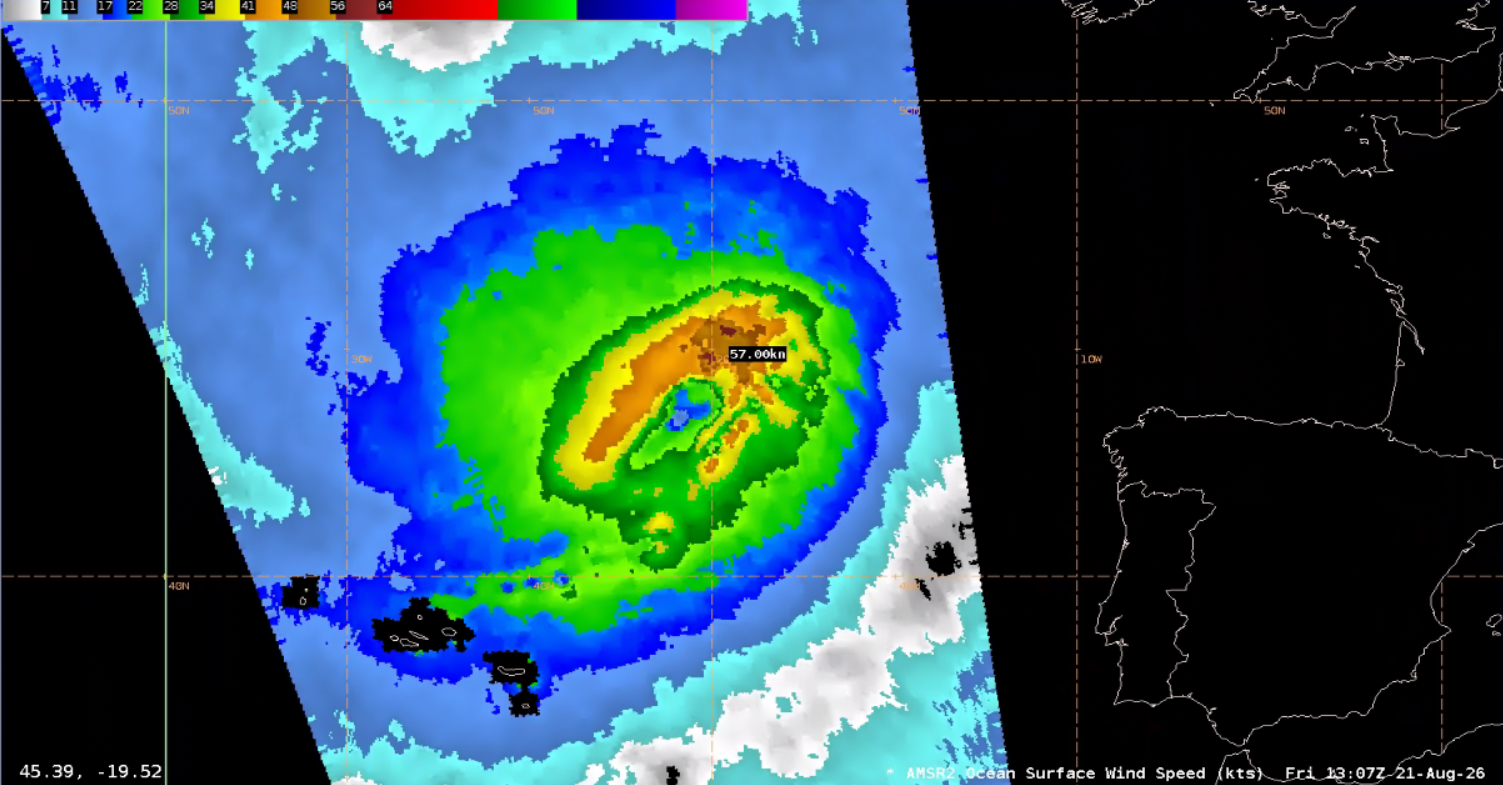
Building off the strengthening trend, NWS OTC designated the low as storm-force at 1200 UTC 21 August 2026. Shortly thereafter, winds derived from a GCOM-W/AMSR2 pass observed speeds in excess of storm-force at 57 knots. AMSR2 products will be decommissioned on September 2 and transition to GOSAT-GW AMSR3 products, which can be implemented in AWIPS.

Figure 5: NWS OTC East Atlantic Surface Analysis valid at 1200 UTC 21 August 2026.
Figure 6: AMSR2 Ocean Surface Winds output at ~1300 UTC 21 August 2026. This image was exported from AWIPS, and display files can be shared upon request.

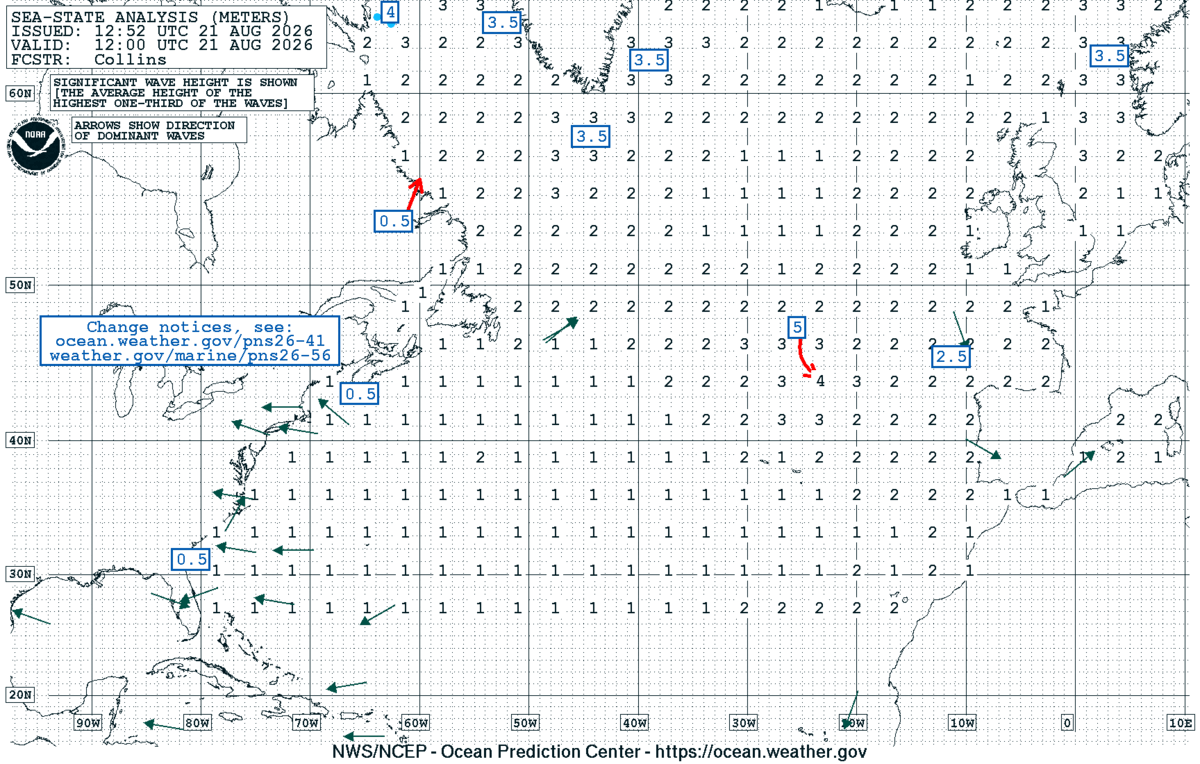
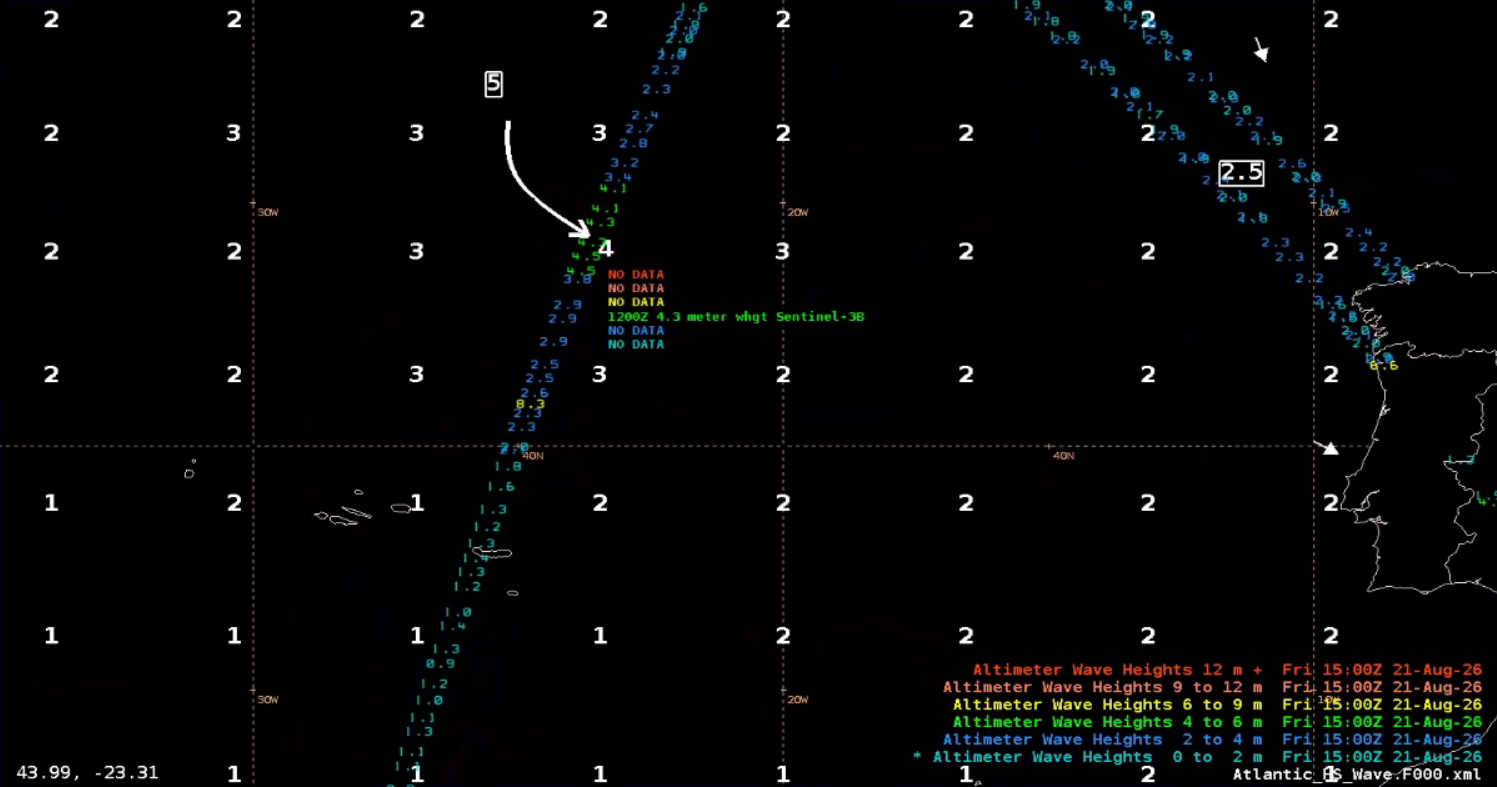
The OTC North Atlantic Sea-State Analysis at 1200 UTC indicated a maximum of 5-meter (~16 feet) seas near the low pressure system. When overlaying the Sea-State Analysis on Sentinel-3B altimeter observations in AWIPS, the values match closely. Sentinel-3B measured significant wave heights up to 4.5 meters.

Figure 7: NWS OTC North Atlantic Sea State Analysis at 1200 UTC 21 August 2026.
Figure 8: Sentinel-3B altimeter observations overlaid with the OTC North Atlantic Sea State Analysis at 1200 UTC 21 August 2026. This image was exported from AWIPS, and display files can be shared upon request.

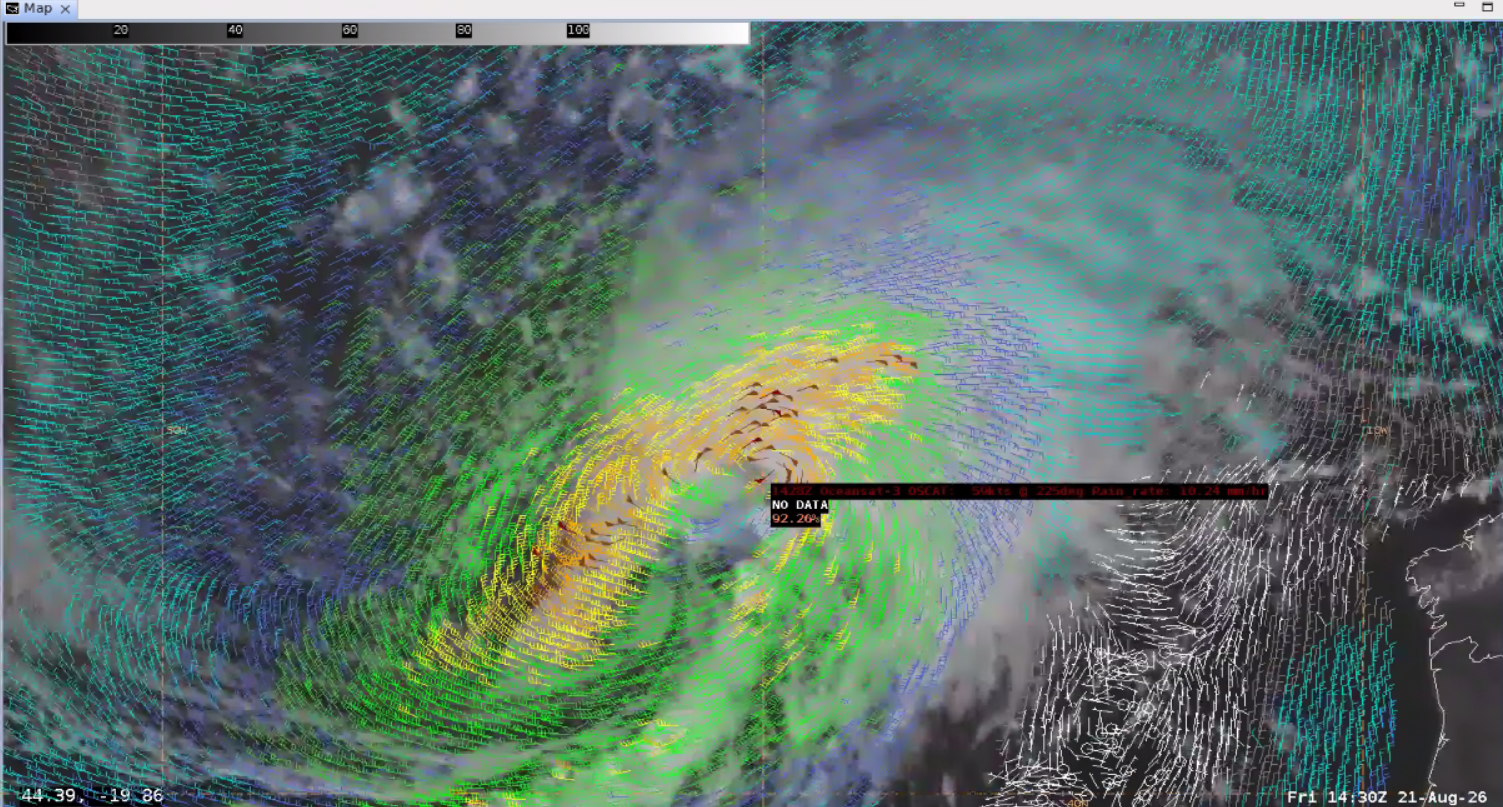
An OSCAT-3 scatterometer pass at ~1430 UTC confirmed what was shown in AMSR2, with wind speeds exceeding 50 knots in the system’s northern quadrant. A few of the OSCAT passes appear rain-contaminated when overlaid on Meteosat-10 visible imagery, with rapid changes in wind direction perpendicular to the satellite pass (like west of the low pressure circulation), but the system looks to solidly be storm-force.

Figure 9: OSCAT Winds overlaid on Meteosat-10 visible imagery at ~1430 UTC 21 August 2026. This image was exported from AWIPS, and display files can be shared upon request.

Red colors of the Meteosat-10 Air Mass RGB imagery can be seen wrapping into the storm, representing dry upper levels and a warmer signature of the upper-level 6.2 micron WV band. This upper-level dry air likely indicates a stratospheric intrusion of potential vorticity-laden air, fueling the system.

Figure 10: Meteosat-10 Air Mass RGB imagery from 0500-1445 UTC 21 August 2026. This animation was exported from AWIPS, and display files can be shared upon request.
Picture of Christopher Smith

Christopher Smith

Christopher Smith joined ESSIC/CISESS, University of Maryland in 2023 and is the GOES-R Satellite Liaison for the NWS Weather and Ocean Prediction Centers. Smith works to interpret experimental satellite imagery and products, and make such products available to forecasters and the NWS for a route to operations. He trains forecasters how to use satellite imagery in weather forecasting, while also delivering forecaster feedback to satellite developers to maximize meteorological satellite capabilities. Smith is an alumni of the UMD Atmospheric & Oceanic Science (AOSC) Department, and his long-term interests include infusing AI-Satellite Products to increase lead time in decision making for forecasters.