University of Maryland

Tropical Storm Edouard Delivers Feet of Rain to Texas

UMD/ESSIC/CISESS GOES-R Satellite Liaison for NWS WPC

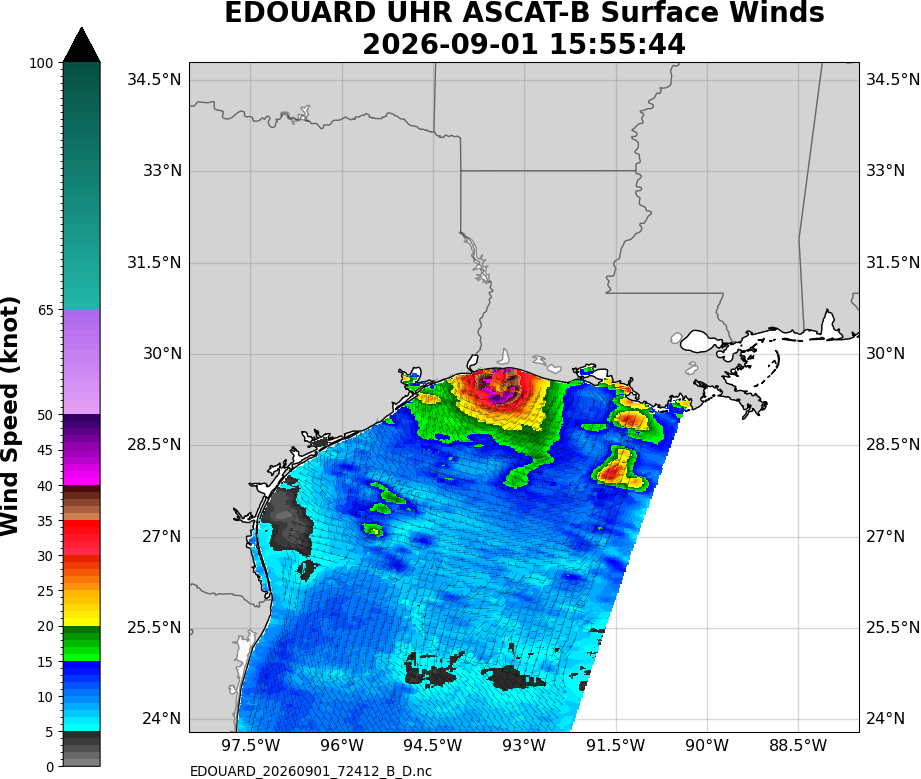
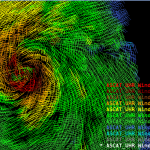
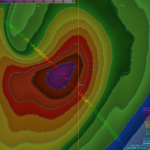
As the calendar closed out Meteorological Summer, Tropical Storm Edouard formed at 0000 UTC 01 September 2026, as declared by the NWS National Hurricane Center (NHC). Edouard was strengthening upon its approach, but with limited time over Gulf waters, it made landfall as a tropical storm with maximum sustained winds of 60 mph near Johnson Bayou, LA, at 1925 UTC 01 September 2026. An Ultra High-Res (UHR) ASCAT pass just prior to landfall at 1555 UTC captured the ocean surface wind speeds approaching 50 knots (~60 mph). UHR ASCAT Winds are processed by NESDIS and utilize each pixel from multi-azimuthal images to downscale ocean surface winds to 4.45 km. UHR ASCAT Winds are available for AWIPS implementation.

UHR Metop-B ASCAT Winds
Figure 1: UHR Metop-B ASCAT Winds at 1555 UTC 01 September 2026. Credit: NESDIS/STAR

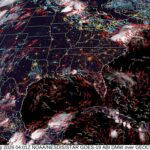
GOES-East CONUS Proxyvis imagery showed the evolution of the system, from a tropical storm during the afternoon of 31 August 2026, to its approach to the Louisiana Coast 24 hours later. Proxyvis allowed the low clouds spinning around Edouard’s circulation to be trackable through the night over the warm waters.

Figure 2: GOES-East CONUS Proxyvis imagery from 1901 UTC 31 August to 1911 UTC 01 September 2026. This animation was exported from AWIPS, and display files can be shared upon request.

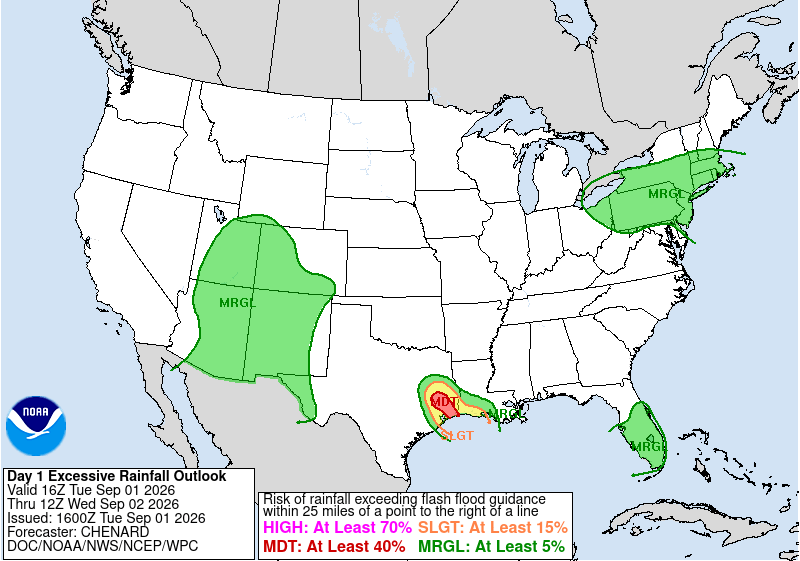
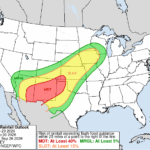
The NWS Weather Prediction Center (WPC) was highlighting the flash flooding threat poised by Tropical Storm Edouard as it moved inland. A Moderate Risk Day 1 Excessive Rainfall Outlook (ERO) was issued by the WPC for the period ending at 1200 UTC 01 September 2026.

NWS WPC ERO
Figure 3: NWS WPC ERO issued at 1600 UTC September 01, valid for the period ending at 1200 UTC 02 September 2026.

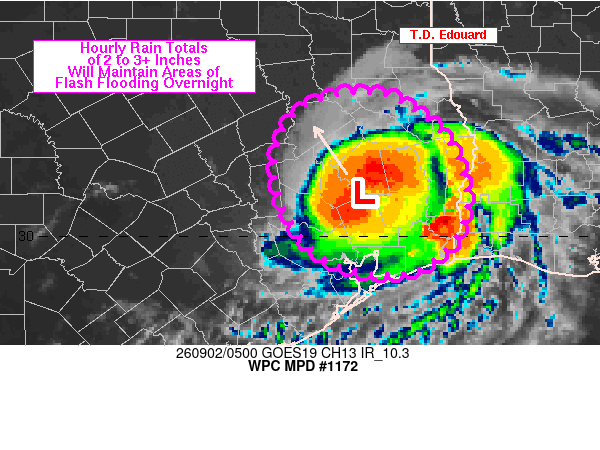
The WPC MetWatch desk issued a Mesoscale Precipitation Discussion (MPD) at 0512 UTC 02 September 2026, with a “Flash flooding likely” tag. The MPD Discussion noted ‘Infrared satellite imagery showed a fairly symmetric CDO’ (central dense overcast) ‘with occasional bursts of colder cloud tops’. GOES-East CONUS Band 13 Infrared (IR) imagery showed that Edouard’s core remained largely intact leading up to issuance of the MPD, despite becoming a Tropical Depression at 0300 UTC. In the animation, multiple Flash Flood Warning (FFW)s can be seen to be issued (green polygons).

NWS WPC MPD
Figure 4: NWS WPC MPD, overlaid with GOES-East IR imagery, issued at 0512 UTC 02 September 2026.

Figure 5: GOES-East CONUS IR imagery, overlaid with FFWs from 2001 UTC 01 September to 0426 UTC 02 September 2026. This animation was exported from AWIPS, and display files can be shared upon request.

GOES-East CONUS IR imagery, overlaid with the GLM Flash Extent Density (FED) showed the nearly stationary storms with high, convective rainfall rates throughout the morning leading to FFWs and even a Flash Flood Emergency (bold green polygon), issued by NWS WFO Lake Charles at 1046 UTC.

Figure 6: GOES-East CONUS Band 13 IR imagery overlaid with GLM FED output and FFWs from 0721-1211 UTC 02 September 2026. This animation was exported from AWIPS, and display files can be shared upon request.

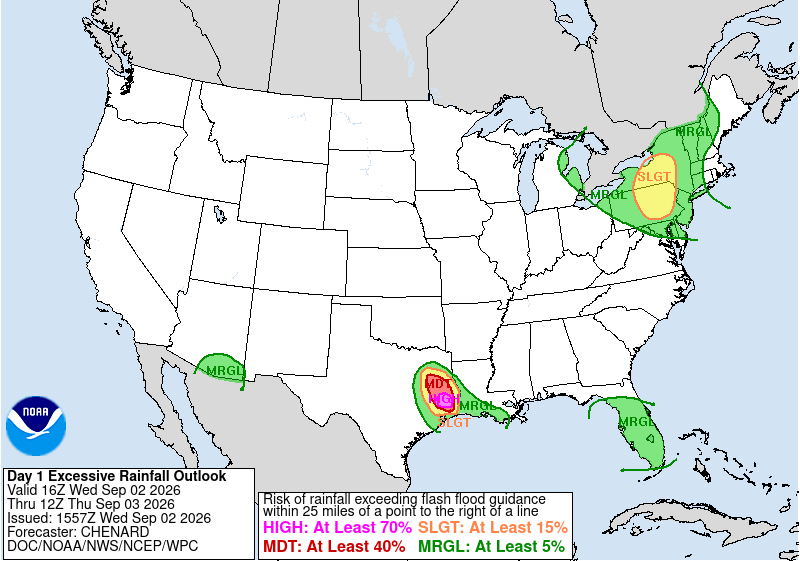
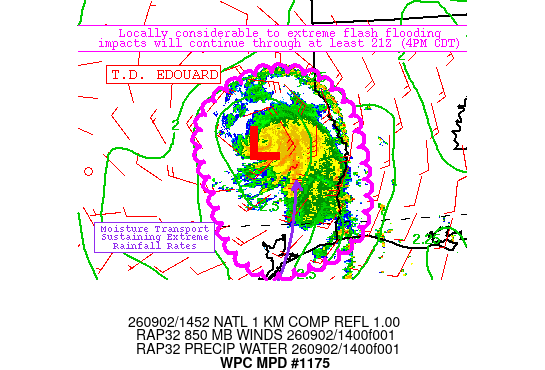
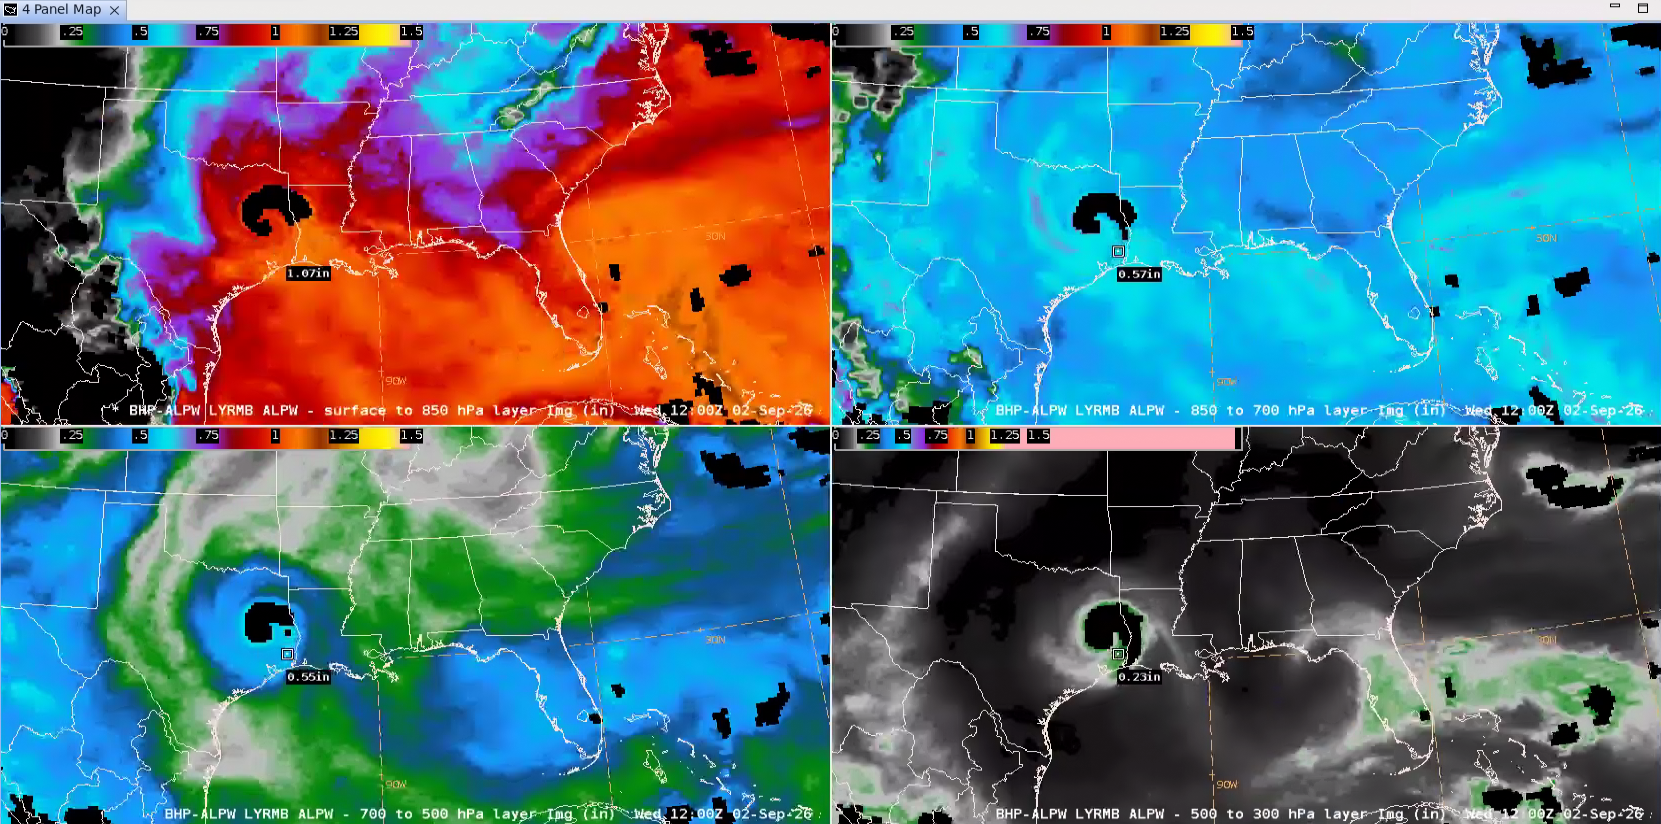
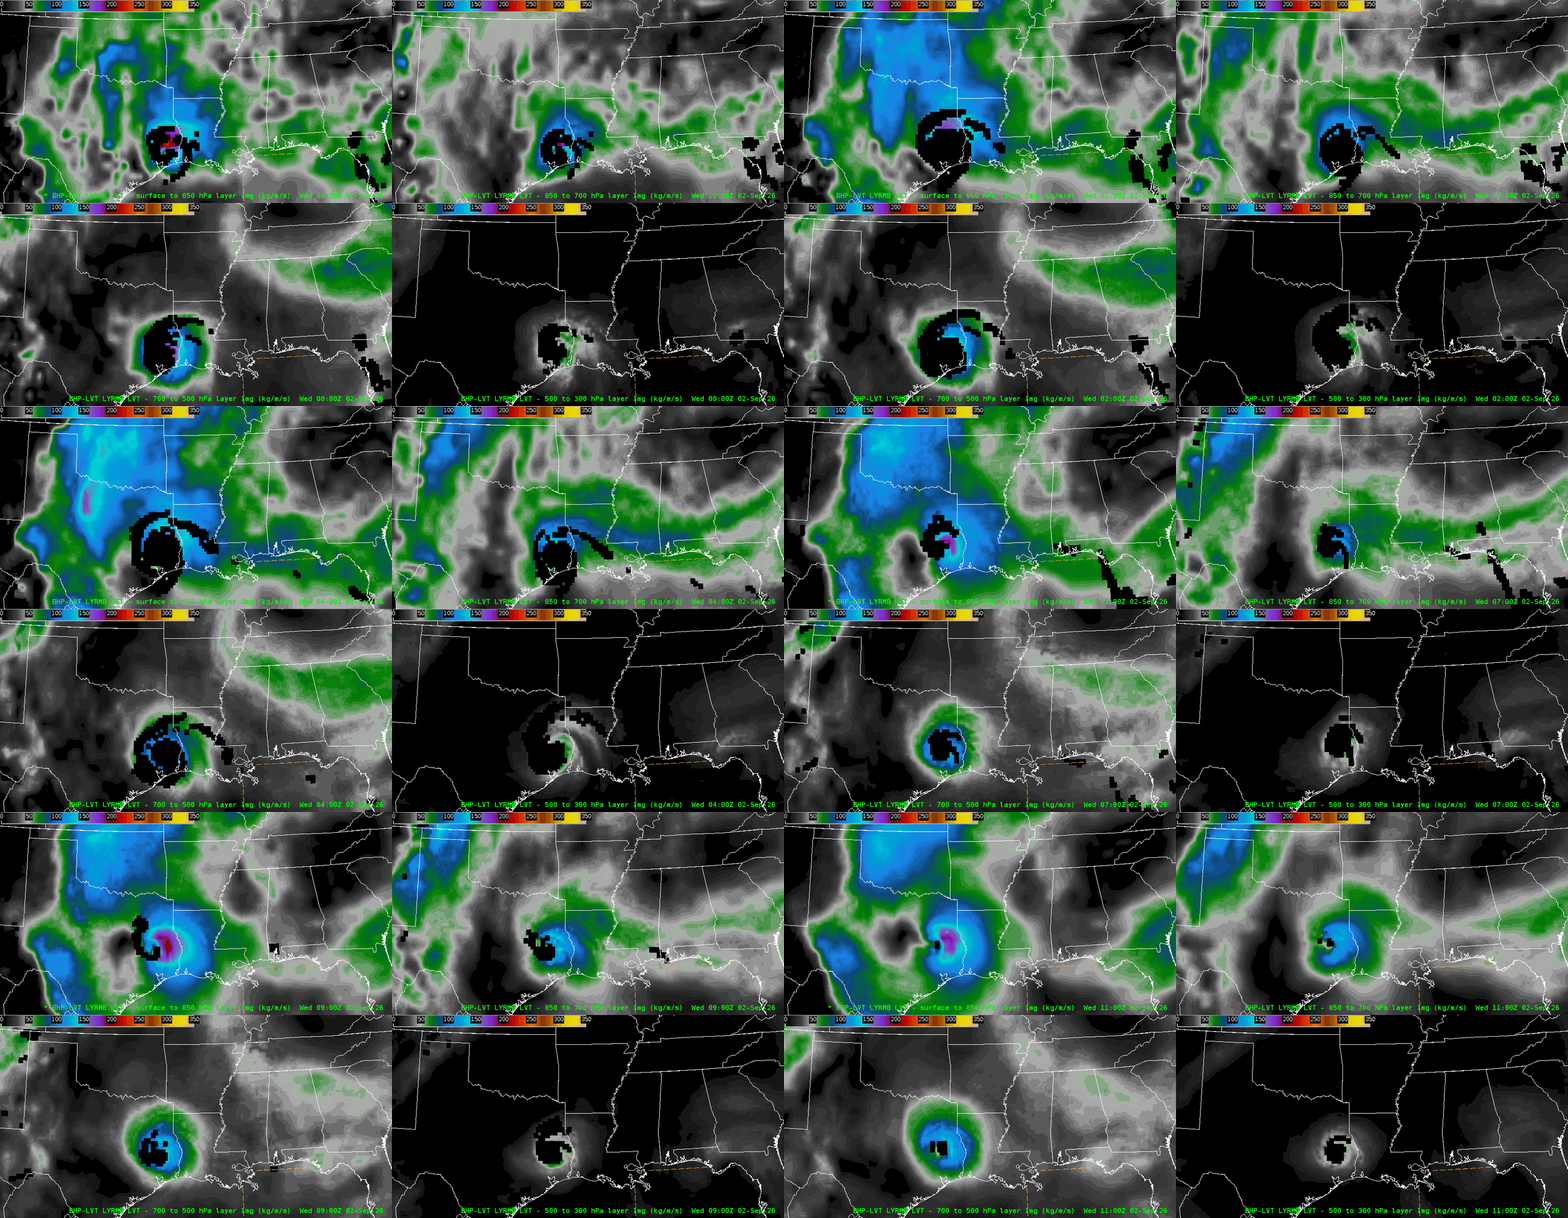
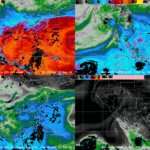
The NWS WPC issued a rare Day 1 High Risk ERO for the period ending at 1200 UTC 03 September 2026. An MPD issued by the WPC at 1455 UTC noted “anomalous moisture as indicated by PWATS in the 2.0-2.5 inch range”. The NESDIS/OSPO Advected Layered Precipitable Water (ALPW) output from just a couple of hours earlier confirmed that PWs exceeded 2.4″ in Southeast TX. Additionally, the CIRA Layered Vapor Transport (LVT) product, recently made available in AWIPS, indicated the circulation from the Tropical Depression was continuing to transport moisture. When summing all four layers, vapor transport values exceed several hundred kg/m/s.

NWS WPC ERO
Figure 7: NWS WPC ERO issued at 1600 UTC September 02, valid for the period ending at 1200 UTC 03 September 2026.
NWS WPC MPD
Figure 8: NWS WPC MPD issued at 1455 UTC 02 September 2026.
NESDIS/OSPO ALPW output
Figure 9: NESDIS/OSPO ALPW output at 1200 UTC 02 September 2026. This image was exported from AWIPS, and display files can be shared upon request.
CIRA LVT output
Figure 10: CIRA LVT output from ~0000-1100 UTC 02 September 2026. This animation was exported from AWIPS, and display files can be shared upon request.

Repeating rounds of convection can be seen leading to additional FFWs in a 24-hour loop of GOES-East CONUS IR imagery into 03 September 2026, even as the Tropical Depression became a remnant low. Over 24″ of rain fell near Thicket, TX, while wind gusts exceeded hurricane-force near Port Arthur, TX, according to the NWS WPC Storm Summary.

Figure 11: GOES-East CONUS Band 13 IR imagery overlaid with FFFWs from 1901 UTC 02 September to 1931 UTC 03 September 2026. This animation was exported from AWIPS, and display files can be shared upon request.

Picture of Christopher Smith

Christopher Smith

Christopher Smith joined ESSIC/CISESS, University of Maryland in 2023 and is the GOES-R Satellite Liaison to the NWS Weather Prediction Center and Ocean and Tsunami Center. Smith works to interpret experimental satellite imagery and products, and make such products available to forecasters and the NWS for a route to operations. He trains forecasters how to use satellite imagery in weather forecasting, while also delivering forecaster feedback to satellite developers to maximize meteorological satellite capabilities. Smith is an alumni of the UMD Atmospheric & Oceanic Science (AOSC) Department, and his long-term interests include infusing AI-Satellite Products to increase lead time in decision making for forecasters.