University of Maryland

Deluge of Heavy Rain Soaks Northeast

UMD/ESSIC/CISESS GOES-R Satellite Liaison for NWS WPC

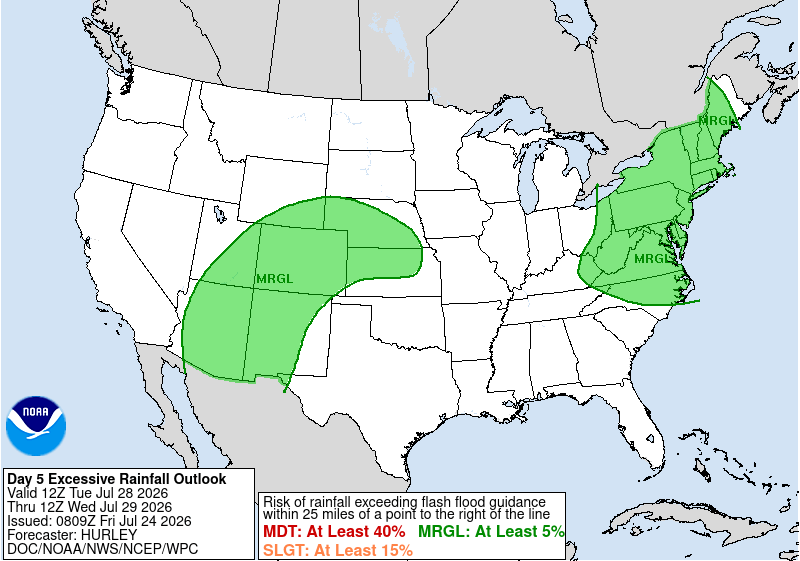
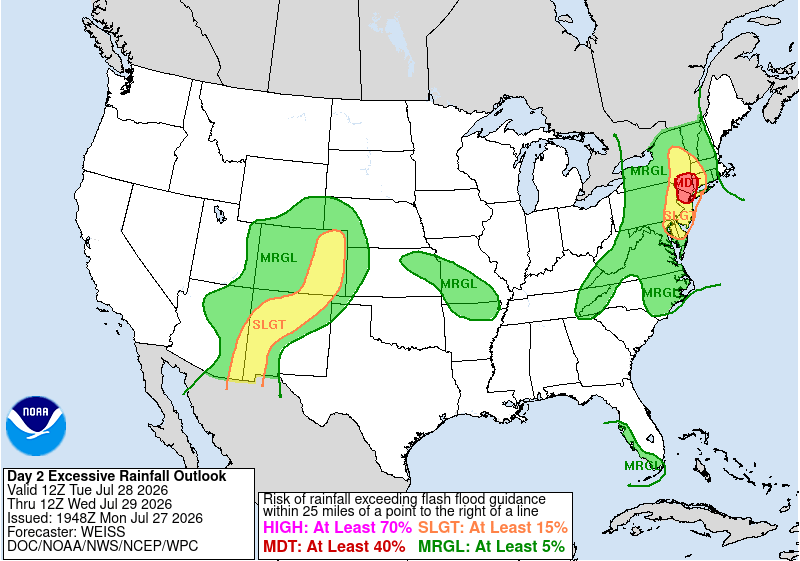
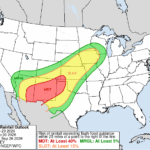
Multiple days of heavy rainfall soaked the Northeast this week, dropping over six inches of rainfall. The NWS Weather Prediction Center (WPC) Extended Forecast Discussion issued at 0744 UTC 22 July 2026 began to message “Ample subsequent northern stream system energies set to dig into the upper trough position over the East should support organized enhanced to heavy convective rainfall”, about a week before the heavy rainfall. By Day 5, a Marginal Risk Excessive Rainfall Outlook (ERO) was issued for the 24-hour period ending at 1200 UTC 29 July, which was upgraded to a Slight Risk by Day 3, and Moderate Risk by Day 2.

NWS WPC Day 5 ERO
Day 2 ERO (right)

Figure 1: NWS WPC Day 5 ERO (left) and Day 2 ERO (right)

One-minute GOES-East Mesosector imagery during the afternoon of 28 July 2026 showed the expanding canopy of storms across much of the Mid Atlantic. LightningCast output, overlaid on the Day Cloud Phase Distinction (DCPD) RGB, had probabilities providing lead time before the GLM observed lightning as convection initiated across Maryland and Virginia, while also capturing the growing complex of storms across Central and Southern New Jersey.

Figure 2: GOES-East Mesosector LightningCast output, overlaid on the DCPD RGB imagery, from 1749-1947 UTC 28 July 2026. This animation was exported from AWIPS, and display files can be shared upon request.

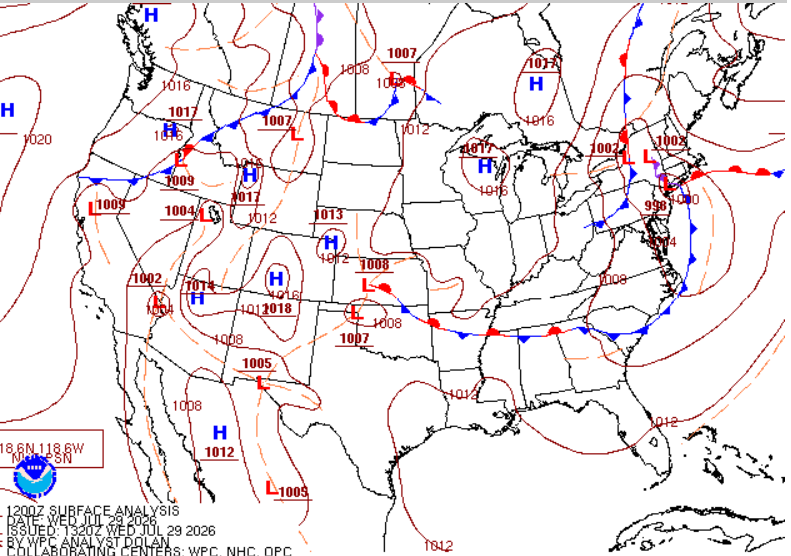
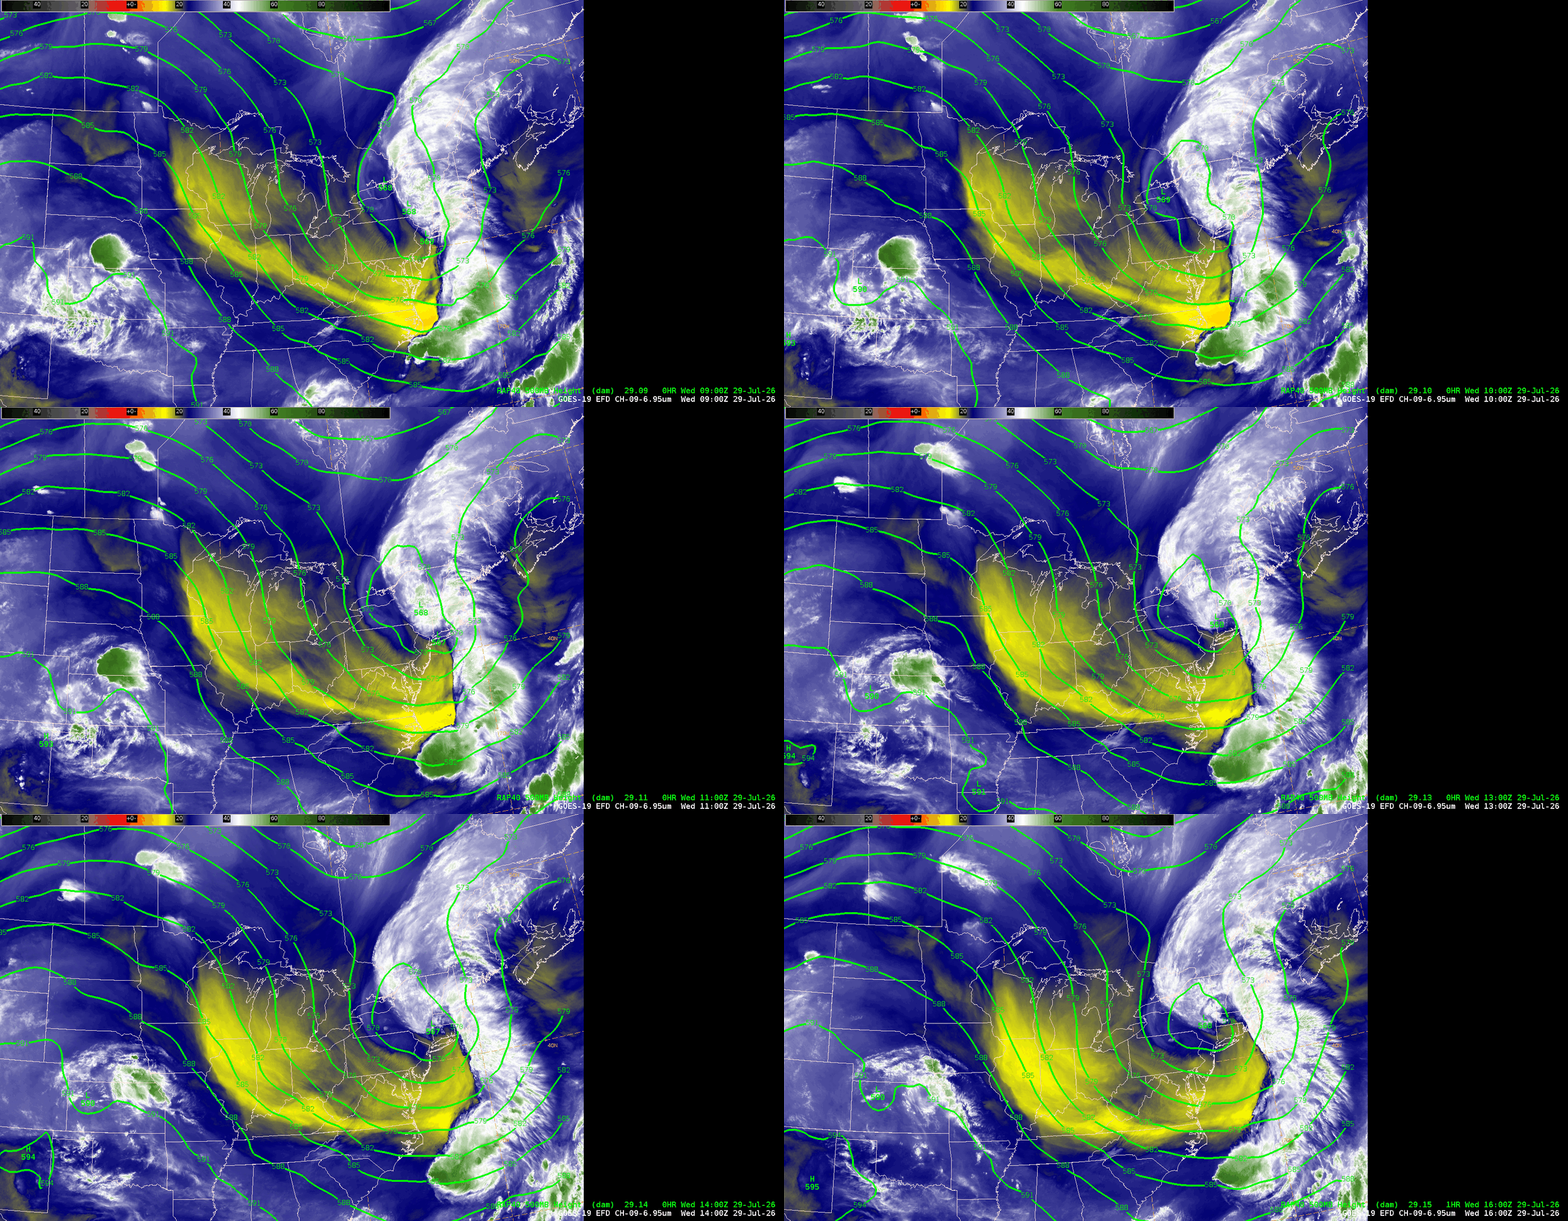
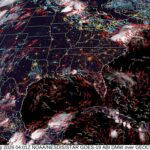
The potent upper-level trough spawned a surface low pressure system, with its swirl quite evident in the morning visible satellite imagery on 29 July 2026. WPC analyzed a 998 hPa low at 1200 UTC. GOES-East Mid-Level Water Vapor (WV) imagery, overlaid with the RAP 500 hPa Geopotential Heights showed the cutoff low as moisture continued to pivot into New England.

Figure 3: GOES-East CONUS Visible Band 02 imagery from 1146-1656 UTC 29 July 2026. This animation was exported from AWIPS, and display files can be shared upon request.

NWS WPC Surface Analysis
Figure 4: NWS WPC Surface Analysis valid at 1200 UTC 29 July 2026.
GOES-East Mid-level WV Band 09 imagery
Figure 5: GOES-East Mid-level WV Band 09 imagery, overlaid with RAP 500 hPa Geopotential Heights from 0900-1600 UTC 29 July 2026. This animation was exported from AWIPS, and display files can be shared upon request.

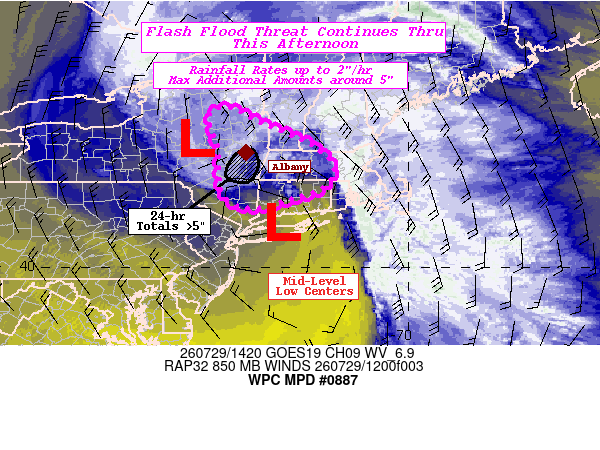
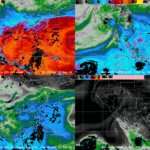
The WPC MetWatch Desk issued a Mesoscale Precipitation Discussion (MPD) at 1440 UTC 29 July discussing the ‘Stacked low-to-mid level low’ that was ‘supplying very moist flow (1.5-1.8″ PWs) from the Atlantic just to the east of this circulation’, elevating the threat for flash flooding over the next six hours. The Advected Layered Precipitable Water (ALPW) Product showed the sufficient transport of moisture at all levels of the atmosphere, though it slowly weakened with time as the cutoff low meandered into 30 July 2026.

Figure 6: NWS WPC MPD issued at 1440 UTC 29 July 2026, overlaid on GOES-East Mid-Level WV imagery.
ALPW output
Figure 7: ALPW output from 1900 UTC 28 July to 0600 UTC 30 July 2026. Credit: CIRA

The evolution of the dynamic system that fired off severe storms and caused flash flooding can be seen in the GOES Mid-Level WV imagery from 1710 UTC 28 July to 1640 UTC 29 July 2026.

Figure 8: GOES-East Mid-Level Water Vapor imagery from 1710 UTC 28 July to 1640 UTC 29 July 2026. This animation was exported from AWIPS, and display files can be shared upon request.

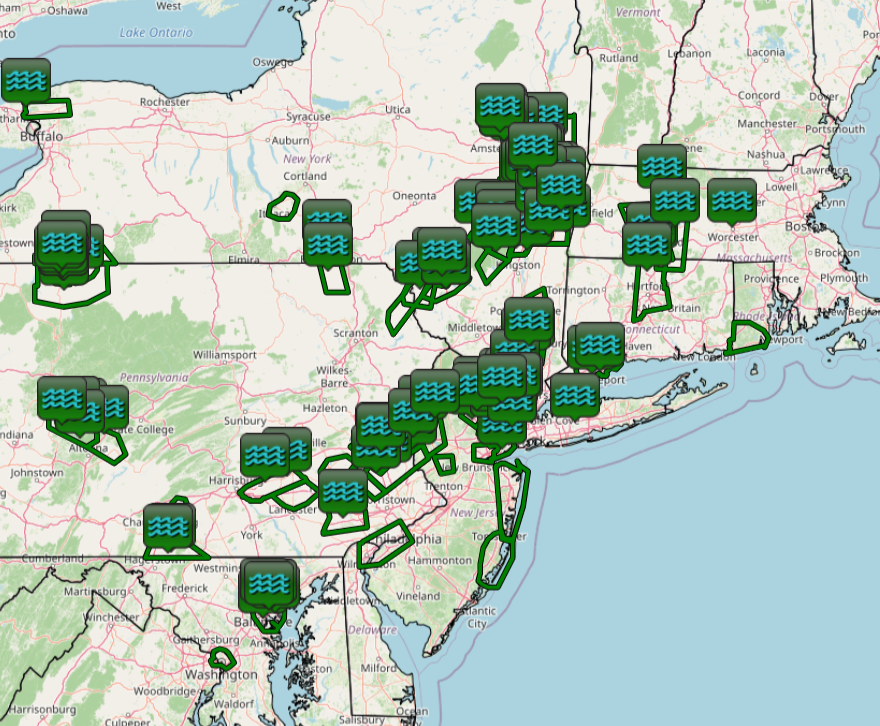
A map of NWS Weather Forecast Office (WFO) Flash Flood Warnings and Flash Flooding Local Storm Reports
Figure 9: A map of NWS Weather Forecast Office (WFO) Flash Flood Warnings and Flash Flooding Local Storm Reports from 28-31 July 2026. Credit: Iowa Environmental Mesonet

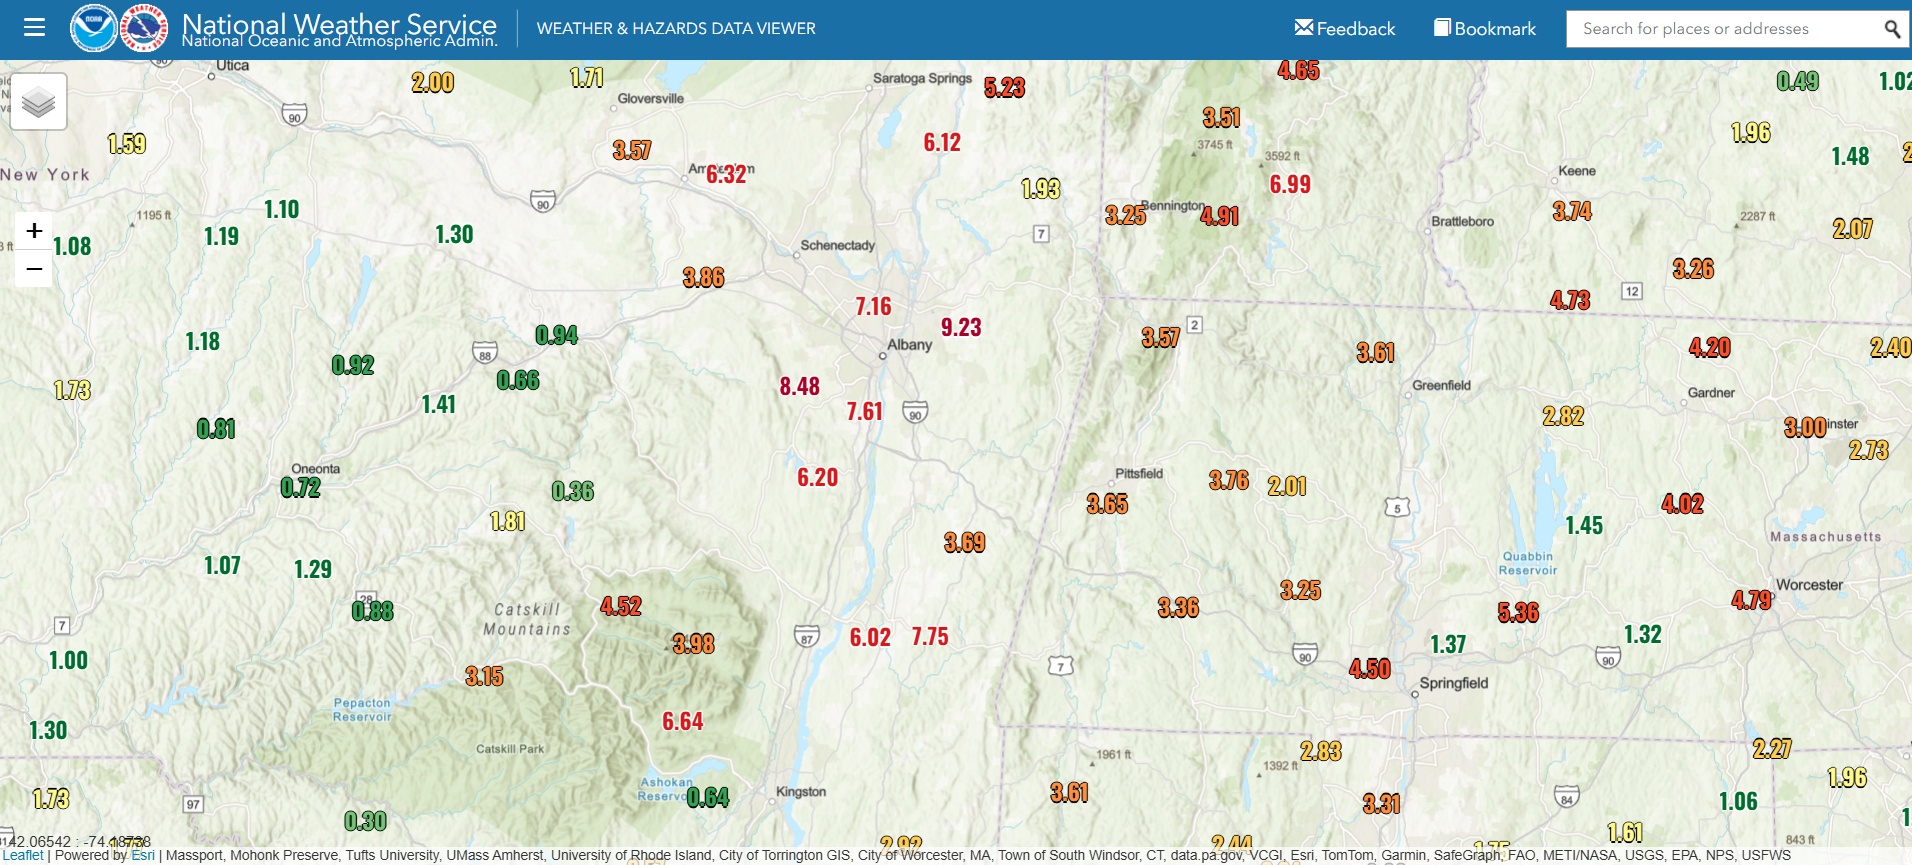
New York’s Capital District received the most rainfall as the system’s ‘comma head’ pivoted overhead, with totals exceeding half of a foot around Albany, up to 9″.

72-hour rainfall totals
Figure 10: 72-hour rainfall totals ending at 1900 UTC 31 July 2026.
Picture of Christopher Smith

Christopher Smith

Christopher Smith joined ESSIC/CISESS, University of Maryland in 2023 and is the GOES-R Satellite Liaison for the NWS Weather and Ocean Prediction Centers. Smith works to interpret experimental satellite imagery and products, and make such products available to forecasters and the NWS for a route to operations. He trains forecasters how to use satellite imagery in weather forecasting, while also delivering forecaster feedback to satellite developers to maximize meteorological satellite capabilities. Smith is an alumni of the UMD Atmospheric & Oceanic Science (AOSC) Department, and his long-term interests include infusing AI-Satellite Products to increase lead time in decision making for forecasters.